
Appearance
Understanding Demographics Data
Quick Answer
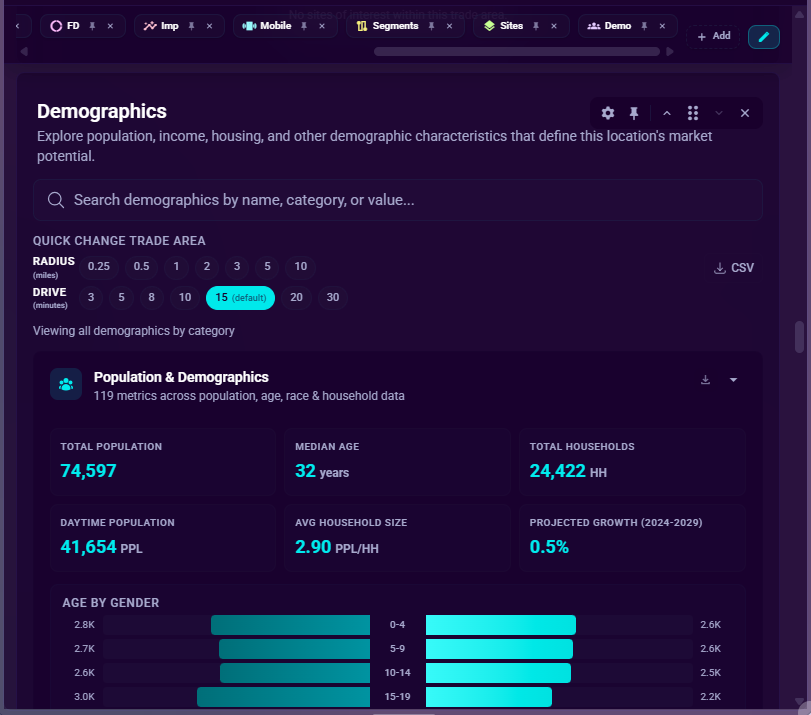
Demographics data shows the characteristics of the population around a location, including population, income, age, housing, education, employment, and more. View it in Chart or List format, filter by business type, save favorites, download what you are viewing with Export CSV, and use the Trade Area Selector to control the geographic radius for demographic data.
Where to Find Demographics
- Select a location on the map
- Open Location Analytics (opens automatically)
- Scroll to the "Demographics" section
- Explore population, income, and other characteristics
Understanding the Demographics Panel
Panel Header
"Explore population, income, housing, and other demographic characteristics that define this location's market potential."
View Controls
| Control | Purpose |
|---|---|
| Search box | Search demographics by name, category, or value |
| Chart/List toggle | Switch between visual cards and table view |
| CSV button (toolbar) | Export the demographics for all trade areas at once (see Exporting to CSV) |
| Export CSV button | List View only - download the demographics you are currently viewing as a CSV |
| Favorites button | Filter to show only favorited metrics |
| Business type filters | Filter metrics relevant to specific business types |
Note: There are two CSV exports and they produce different files. The CSV button in the panel toolbar (beside the trade area selector) exports every trade-area band for the site in one file. The Export CSV button in List View downloads only the rows you are currently viewing for the selected trade area. See Exporting to CSV below.
View Modes
Chart View (Default)
Displays demographics as interactive cards organized by category:
- Category header with icon and metric count
- Key metric highlight showing most important value
- KPI cards (when present) for standalone single-value metrics such as total population or median age -- these appear as labeled tiles above the chart
- Donut or bar chart visualizing the data
- Metrics list showing all values in the category
List View
Displays all demographics in a sortable table:
- Favorite icon (heart) - indicates saved favorites
- Category - the grouping for each metric
- Variable Name - description of the metric
- Value - the formatted value
- Sortable columns - click headers to sort
- Export CSV - downloads the rows currently displayed, with four columns: Category, Variable Name, Value (the formatted display value, such as
$75,500), and Raw Value (the same number unformatted, so you can sum, sort, and chart it in a spreadsheet). Raw Value is blank where no numeric value is available.
Exporting to CSV
The Demographics panel offers two separate CSV exports.
Export all trade areas (the toolbar CSV button)
The CSV button in the panel toolbar (next to the trade area selector) exports the site's demographics for every trade-area band at once - all 7 radius rings and all 7 drive-time bands - in a single file. Each row is one demographic variable and each column is one trade-area band, so you can pivot a whole site's demographics across trade areas in a spreadsheet without switching the selector by hand.
- The export runs against all bands in the background; it does not change the trade area you currently have selected in the panel.
- While the export is preparing, the button shows Exporting... and is disabled so it cannot race the trade area selector. It is also disabled while demographics are still loading or a trade-area change is in flight.
- If a band fails to load, that band's column is omitted and you are notified which bands were unavailable; the rest of the file still downloads. A band that is genuinely empty is kept as an empty column.
- This button is available in both Chart and List view. It does not appear in read-only surfaces such as the frozen report viewer or a shared report link.
Export the current view (the List View Export CSV button)
The Export CSV button inside List View downloads only the rows currently on screen for the selected trade area, with four columns: Category, Variable Name, Value (the formatted display value, such as $75,500), and Raw Value (the same number unformatted). The active trade area, business type filter, favorites toggle, search, and sort order all carry through to the file. Switch from Chart View to List View if you do not see this button.
Demographic Categories
The following categories organize demographic data:
| Category | What It Contains |
|---|---|
| Population | Total population, density, growth trends |
| Income | Median household income, income distribution |
| Age | Median age, age brackets, family composition |
| Housing | Homeowners vs renters, housing values |
| Education | Education levels, attainment rates |
| Employment | Employment rates, occupation types |
| Race/Ethnicity | Racial and ethnic composition |
| Transportation | Commute patterns, vehicle access |
| Households | Household size, composition |
| Consumer | Spending patterns, consumer behavior |
| Retail | Retail spending potential |
| Health | Health-related demographics |
| Economy | Economic indicators |
Note: Geography category is excluded from display (contains coordinates, not useful for analysis).
Canada Projects
When your project is set to Canada, the Demographics panel adapts automatically:
Canada-specific chart categories
In addition to the standard Population, Age, and Income charts, Canadian projects show additional chart sections sourced from Statistics Canada / Claritas-Canada data:
| Chart section | What it shows |
|---|---|
| Religion | Breakdown by religious affiliation (Christian, Muslim, Hindu, etc.) |
| Marital Status | Married, Common-Law, Never Married, Divorced, Separated, Widowed |
| Household Composition | One-Family, Multi-Family, One-Person, Non-Family households |
| Household Size | Distribution across 1 to 5+ person households |
| Housing Tenure | Owned vs. Rented vs. Band Housing |
| Period of Construction | Age of housing stock by decade (pre-1961 through post-2016) |
| Structure Type | Single-Detached, Semi-Detached, Row House, Apartment, etc. |
| Place of Birth | Country or region of birth for the population |
| Commute Mode | How residents commute (car, transit, walk, etc.) |
| Mobility | Residential moves over the past 5 years |
| Immigration | Period of immigration, origin region |
| Language at Home | Primary language spoken at home |
| Income Distribution | Canadian income brackets (Claritas-Canada) |
These sections appear only for Canadian projects. US projects show the standard US AGS demographic sections (Hispanic origin, Race/Ethnicity, Class of Workers, Vehicles, etc.) instead.
Sections not available for Canada
The following analytics sections require US-only data sources and are automatically hidden for Canadian projects:
| Section hidden for CA | Data source (US-only) |
|---|---|
| Smart Comps | BlackBox (no Canada coverage) |
| Traffic Overview/Detail | INRIX (no Canada coverage) |
These sections re-appear if you switch the project back to a US location.
Mobile Data is available for Canadian projects. Where mobile-data coverage hasn't been acquired for a Canadian market yet, the Mobile Data section shows an empty state instead of being hidden.
Demographic settings
In the Demographics Settings panel, Canada-only chart toggles appear under the Canada group when a Canadian project is active. Use these toggles to show or hide individual CA chart cards, just like the standard toggle controls for US chart sections.
Business Type Filters
Filter demographics to show metrics most relevant to your business:
| Business Type | Focus Areas |
|---|---|
| Retail Store | Consumer spending, income, traffic |
| Restaurant | Population density, dining habits, income |
| Healthcare | Age distribution, insurance, health metrics |
| Fitness | Age groups, health consciousness, income |
| Education Services | Family composition, education levels |
| Financial | Income, employment, homeownership |
| Grocery | Household size, income, food spending |
| Real Estate | Housing values, homeownership, income |
Using Business Filters
- Click a business type button to filter
- Metrics are sorted by relevance to that business
- Click Clear Filter to see all metrics
- Works in both Chart and List views
Trade Area
Demographics data is calculated for the geographic area defined by the Trade Area Selector at the top of the analytics panel. You can choose from ring distances (0.25 to 10 miles) or drive times (3 to 30 minutes). Changing the trade area reloads all demographic data for the new boundary.
See Trade Area Selector for full details.
Favorites
Favorites
- Click the Favorites button (heart icon) to filter
- Shows only metrics you've marked as favorites
- Counter shows number of favorites (e.g., "Favorites (5)")
How Favorites Work
- Click the heart icon next to any variable to toggle favorite status
- Pink heart = favorited, gray outline = not favorited
- Favorites are synced to your SiteZeus account and persist across sessions
- The Favorites filter state (on/off) is also saved as a workspace preference and survives page refreshes; if the filter is on when a report is generated, the report shows only favorited variables
- Favorites also appear in the Variable Importance legend table
See Favorite Variables for full details.
Key Metrics
Understanding Key Metrics
Each category card shows a key metric in the header:
- The most important value for that category
- Quick reference without expanding
- May show "Most Prominent" for composition data
Examples
| Category | Key Metric |
|---|---|
| Population | Total Population |
| Income | Median Household Income |
| Age | Median Age |
| Traffic | Average Commute Time |
| Other categories | Most Prominent value (with percentage) |
Chart Visualizations
Donut Charts
Used for compositional data (parts of a whole):
- Income brackets
- Age distribution
- Education levels
- Housing types
Click segments to see details.
When a category contains more than 12 segments, the donut shows the top 12 by value and aggregates all remaining segments into a single Others slice. Hover or click Others to see the combined value.
Bar Charts
Used for comparative data:
- Multiple metrics in same category
- Values that don't sum to 100%
- Scrollable for many metrics
Click bars to see details.
Search Functionality
How to Search
- Type in the search box at the top
- Searches across: name, category, and value
- Results filter in real-time
- Clear with X button
Search Examples
- "income" - finds all income-related metrics
- "median" - finds median values
- "population" - finds population metrics
- "$50,000" - finds specific values
Using Demographics for Decisions
For Site Selection
- Compare demographics across proposed sites
- Identify areas matching your target customer
- Understand market potential
For Market Analysis
- Assess population and income levels
- Understand competitive dynamics
- Identify growth opportunities
For Business Planning
- Use business type filters for relevant data
- Focus on metrics that drive your business
- Save favorites for quick access
Tips
Efficient Navigation
- Use search for specific metrics
- Toggle Chart/List based on preference
- Use business filters to focus
Understanding Data
- Note the suffix (%, $, count) for context
- Compare to benchmarks you know
- Consider trends, not just current values
Export and Share
- Use the toolbar CSV button (either view) to export every trade-area band for the site in one file, or, in List View, click Export CSV to download exactly the rows on screen for the selected trade area. See Exporting to CSV for the difference
- In Chart View, take screenshots for reports
- Note key metrics for presentations
- Ask AI to summarize demographics
Troubleshooting
No Data Showing
- Select a location first
- Wait for data to load
- Demographics may not be available for all areas
Metrics Not Finding in Search
- Try different keywords
- Check spelling
- Clear search to see all
Chart Not Displaying
- Some categories may have limited data
- Try List view for complete data
- Refresh if needed