
Appearance
What is a Zeustimate?
See also (agent workflow):
analytics-composition.mddescribes how the agent picks between a single-tool Zeustimate fetch and a full executive-summary fan-out depending on how narrow your ask is.
Quick Answer
A Zeustimate is Zeus.ai's AI-powered revenue prediction for a location. It estimates potential annual revenue based on demographics, competition, and other factors, along with a confidence range, revenue grade, and comparison to your portfolio's average.
Where to See a Zeustimate
Location
Zeustimates appear in the Location Analytics tab when you select a location:
- Find a location on the map
- Click the marker to select it
- Location Analytics opens automatically
- Look for
Zeustimate Forecast(orRevenue Metricsfor existing sites)
Understanding the Zeustimate Display
The Zeustimate visualization adapts based on the site type (Proposed vs Existing).
1. Proposed Sites (Full Analytics)
For sites in Consideration, Approved, or In Development status:
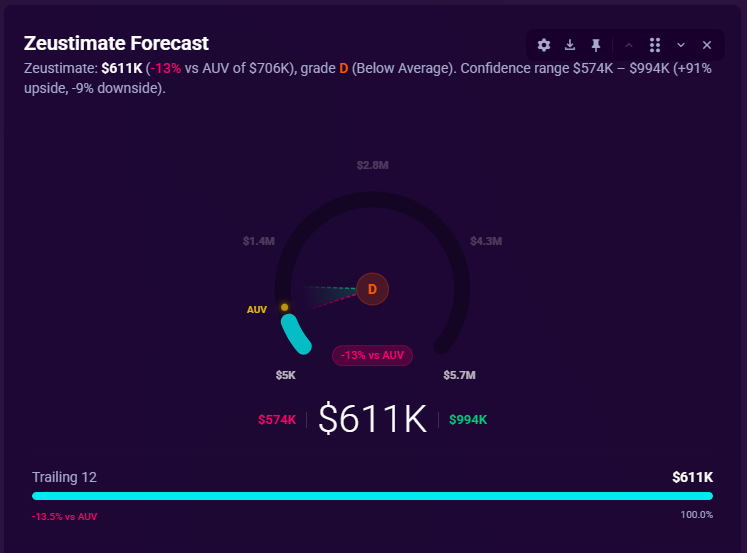
- Shows: AI-predicted annual revenue
- Analytics: Full access to Forecast Drivers, Demographics, and Smart Comparables
- Purpose: To evaluate potential performance before building
2. Existing Sites (Actual Metrics)
For Mature, New, or Closed sites:
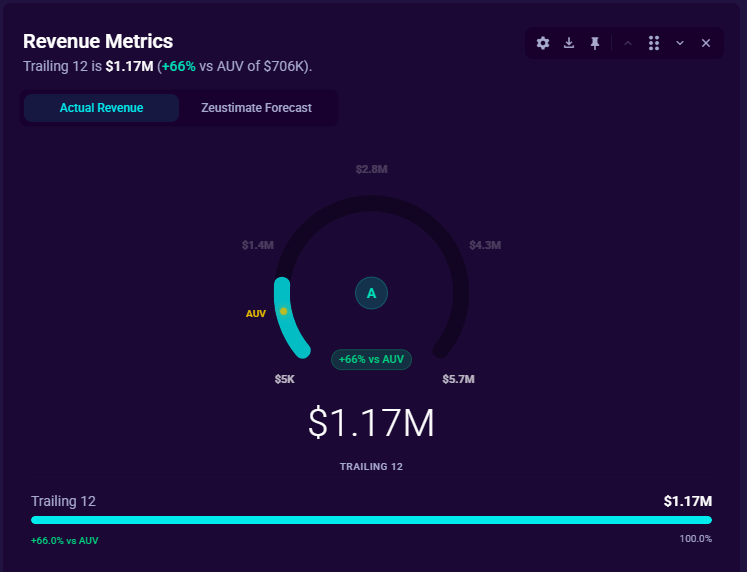
- Shows: Actual historical revenue (labeled "Revenue Metrics")
- Analytics: Limited to actual performance data vs AUV
- Purpose: To benchmark current performance against the portfolio
- Note: Predictive tools like Variable Importance are typically not shown for existing sites as actual data takes precedence.
Key Components
When you view a Zeustimate (or Revenue Metric), you'll see:
Main Revenue Prediction/Value
The primary number displayed prominently (e.g., $1,850,000)
2. Revenue Grade Badge
A letter grade (A, B, C, D, or F) with color coding:
| Grade | Label | Meaning | Color |
|---|---|---|---|
| A | Top Performer | Top performers, significantly above average | Emerald green |
| B | High Performer | Above average performance | Green |
| C | Average | Around the portfolio average | Yellow |
| D | Below Average | Below average but acceptable | Orange |
| F | Needs Improvement | Significantly underperforming | Red |
The grade is calculated by comparing the location's revenue to your portfolio's mature site distribution.
3. AUV (Average Unit Volume) Comparison
Shows how this location compares to your portfolio benchmark:
- AUV Value: The average revenue of mature sites in your portfolio (shown in yellow)
- % vs AUV: Percentage above or below the average
- Green badge with "+" means above AUV
- Red badge with "-" means below AUV
4. Confidence Interval
The statistical range where actual revenue is likely to fall:
- Lower Bound: Minimum expected revenue (downside scenario)
- Upper Bound: Maximum expected revenue (upside scenario)
- Displayed as a range (e.g., "$1.5M - $2.1M")
5. Upside/Downside Percentages
Risk and opportunity assessment:
- Upside (green): Potential percentage increase to upper bound
- Downside (red): Potential percentage decrease to lower bound
Example: "+12% upside" and "-15% downside"
Zeustimate Visualizations
Revenue Gauge
A circular gauge showing the revenue position within the portfolio range:
- Colored arc: Progress to the current value (color based on grade)
- White needle: Points to the forecast/actual revenue
- Yellow marker: Indicates AUV (Average Unit Volume) position
- Red/Green cones: Show downside and upside confidence ranges
- % vs AUV badge: Quick comparison to average in the center
Confidence Graph
A bell curve distribution showing:
- White curve: Revenue distribution across mature sites
- White line: Forecast/actual revenue position
- Yellow dashed line: AUV benchmark
- Red/Green dashed lines: Confidence interval bounds (downside/upside)
- Red fill: Downside area (below forecast)
- Green fill: Upside area (above forecast)
Range Overview Bar
A horizontal bar showing at-a-glance positioning:
- Position along the min-max revenue range
- AUV marker (yellow)
- Confidence interval highlighted
- Forecast marker (white)
Display Options
You can customize parts of the Zeustimate visualization through the section controls and analytics panel options.
Available Toggles
Main Sections:
- Key Metrics: The metrics table (Forecast, Range, AUV, Min/Max, Upside/Downside)
- Revenue Summary: The descriptive text summary
Revenue Gauge Options:
- Upside/Downside: Red and green confidence cones
- Forecast Needle: In the full gauge, hides all forecast arcs (the sub-revenue segment stack and the single arc). Grade, AUV, confidence interval, and scale remain visible. In the compact Revenue Gauge, hides the range bar.
- Forecast Number: In the full gauge, hides the forecast value and the lower/upper confidence bounds. In the compact Revenue Gauge, hides the forecast number.
- AUV Marker: The yellow benchmark marker
- Confidence Interval: The lighter confidence arc
Confidence Graph Options:
- Distribution Curve: The bell curve shape
- Forecast Line: Vertical line at the forecast value
- AUV Line: Yellow vertical line at the average
- Upside/Downside: Red/green boundary lines
- Labels: Text labels above the lines
Key Metrics Explained
| Metric | What It Means |
|---|---|
| Forecast/Actual | Predicted (proposed) or actual (existing) annual revenue |
| Forecast Range | This site's own confidence interval — the lower and upper bounds shown on the Analyze panel gauge |
| Average Range | Model-wide benchmark range across comparable sites in the model — not this site's individual bounds |
| AUV | Average Unit Volume - mature site portfolio average |
| Min/Max | Absolute best/worst-case extremes of the model's revenue distribution — present for every site regardless of confidence. Not the same as the Forecast Range (confidence interval). A wide min-max spread does not mean the forecast is uncertain; use Forecast Range width to judge prediction certainty. |
| Upside | Potential increase to upper bound (% and $) |
| Downside | Potential decrease to lower bound (% and $) |
Using Zeustimates Effectively
For Site Selection
- Compare Zeustimates across candidate locations
- Higher Zeustimate = higher revenue potential
- Consider confidence interval width (narrow = more certain)
- Look at the grade for portfolio context
For Analysis
- Understand why a location scores high or low
- Review Variable Importance to see key drivers
- Check Demographics for market potential
- Use Smart Comps to see similar sites
Questions to Ask the AI
- "What's the Zeustimate for this location?"
- "Why does this site have a high/low Zeustimate?"
- "Compare Zeustimates for my top 3 proposed sites"
- "Which factors most affect this prediction?"
- "How does this compare to the AUV?"
- "What is the Forecast Range for this site?"
- "How does this site's Forecast Range compare to the Average Range?"
Understanding Revenue Grades
How Grades Are Calculated
Grades are based on your portfolio's actual mature site revenue distribution:
- All mature existing sites are analyzed
- Revenue ranges are calculated (percentiles)
- The location's revenue is compared to these ranges
- A grade is assigned based on where it falls
What Grades Tell You
- A: This location is in the top tier of your portfolio
- B: High performer, above the typical site
- C: Performing at or near your portfolio average
- D: Below average but may still be acceptable
- F: Needs improvement, significantly underperforming compared to peers
Grade Requirements
Grades require sufficient mature site data in your portfolio to calculate meaningful ranges. If you see "No Revenue Data," there aren't enough mature sites to establish benchmarks.
Zeustimate for Existing vs Proposed Sites
Proposed Sites
- Shows predicted revenue (Zeustimate)
- Full analytics available
- Confidence interval reflects prediction uncertainty
- Grade shows expected performance tier
Existing Sites
- Shows actual revenue (Revenue Metrics)
- Same visualization format
- Confidence interval may be narrower
- Grade shows actual performance tier
- Useful for comparing to AUV and portfolio
When a Zeustimate Can't Be Shown
Zeus.ai will not fabricate a revenue number when it does not have the inputs to stand behind one. Instead of quietly showing a zero or a placeholder, the gauge shows a clear empty state so you know the figure is genuinely unavailable rather than actually low:
- "No forecast available" — shown on a proposed site when a forecast cannot be produced (for example, the model is missing required attributes or has too few comparable sites to work from). The gauge reads "No forecast is available for this location."
- "No revenue data" — shown when an existing site is viewed in actual-revenue mode and has no recorded revenue. The gauge reads "No recorded revenue is available for this location." (An existing site viewed in forecast mode shows "No forecast available" instead.)
If you hit one of these states, add the missing inputs and the forecast returns automatically: for a proposed site, check the site's attributes and your model settings; for an existing site, record its actual revenue. This "fail loudly" behavior replaces the previous handling, where a missing input could silently produce a zeroed forecast.
Frequently Asked Questions
How accurate are Zeustimates?
Accuracy varies by market and data availability. High-confidence predictions with narrow intervals are typically within 10-20% of actual performance. Always consider the confidence interval.
Why is my Zeustimate low?
Check Variable Importance to see which factors are pulling it down. Common reasons: high competition, low population density, unfavorable demographics, or distance from traffic generators.
Why is the grade different from what I expected?
Grades are relative to your portfolio. A $1M site might be an "A" in one portfolio but a "C" in a higher-performing portfolio. The grade reflects performance relative to your mature sites.
How often are Zeustimates updated?
Zeustimates update when new data becomes available or when the prediction model is refined. The displayed values reflect the latest calculation.
Can I see Zeustimates for all locations at once?
Use the Sites tab to see revenue values in the list view. Click individual locations to see full Zeustimate visualizations.
What the AI can do for you with this
The Zeustimate is one of the four canonical "leaf" analytics the agent fans out across in its executive summary. Capabilities (catalog names):
- Zeustimate Forecast (
getZeustimate) — return the forecast with Forecast Range (this site's confidence bounds), Average Range (model-wide benchmark), performance grade, and AUV comparison. The agent labels these two ranges by name so answers match what you see on the Analyze panel gauge. - Forecast Drivers (
getVariableImpact) — explain why the Zeustimate came out where it did (positive and negative drivers). - Smart Comparables (
getSmartComps) — show which existing portfolio sites the model treated as analogs. - Demographics (
getDemographics) — confirm the trade-area inputs the model used. - Compare Sites & Shapes (
compareEntities) — Zeustimate-versus-Zeustimate across a candidate set.
Note: the agent tool is named getZeustimate (not getZeustimateForecast — that was an old name).
Worked example
"What's the revenue forecast for the Orange Creek site?"
The agent recognizes a narrow forecast ask and runs only getZeustimate rather than a full executive-summary fan-out. Follow up with "Why is it that high?" and the agent calls getVariableImpact on the same site. This pair is in the probe-scenarios/executive-summary.mjs regression suite under "narrow ask".