
Appearance
Using Data Layers
See also (agent workflow):
shape-analytics.mdcovers how the assistant treats shapes (trade areas + territories) as first-class analytics subjects on top of the layer toggles described here.
Quick Answer
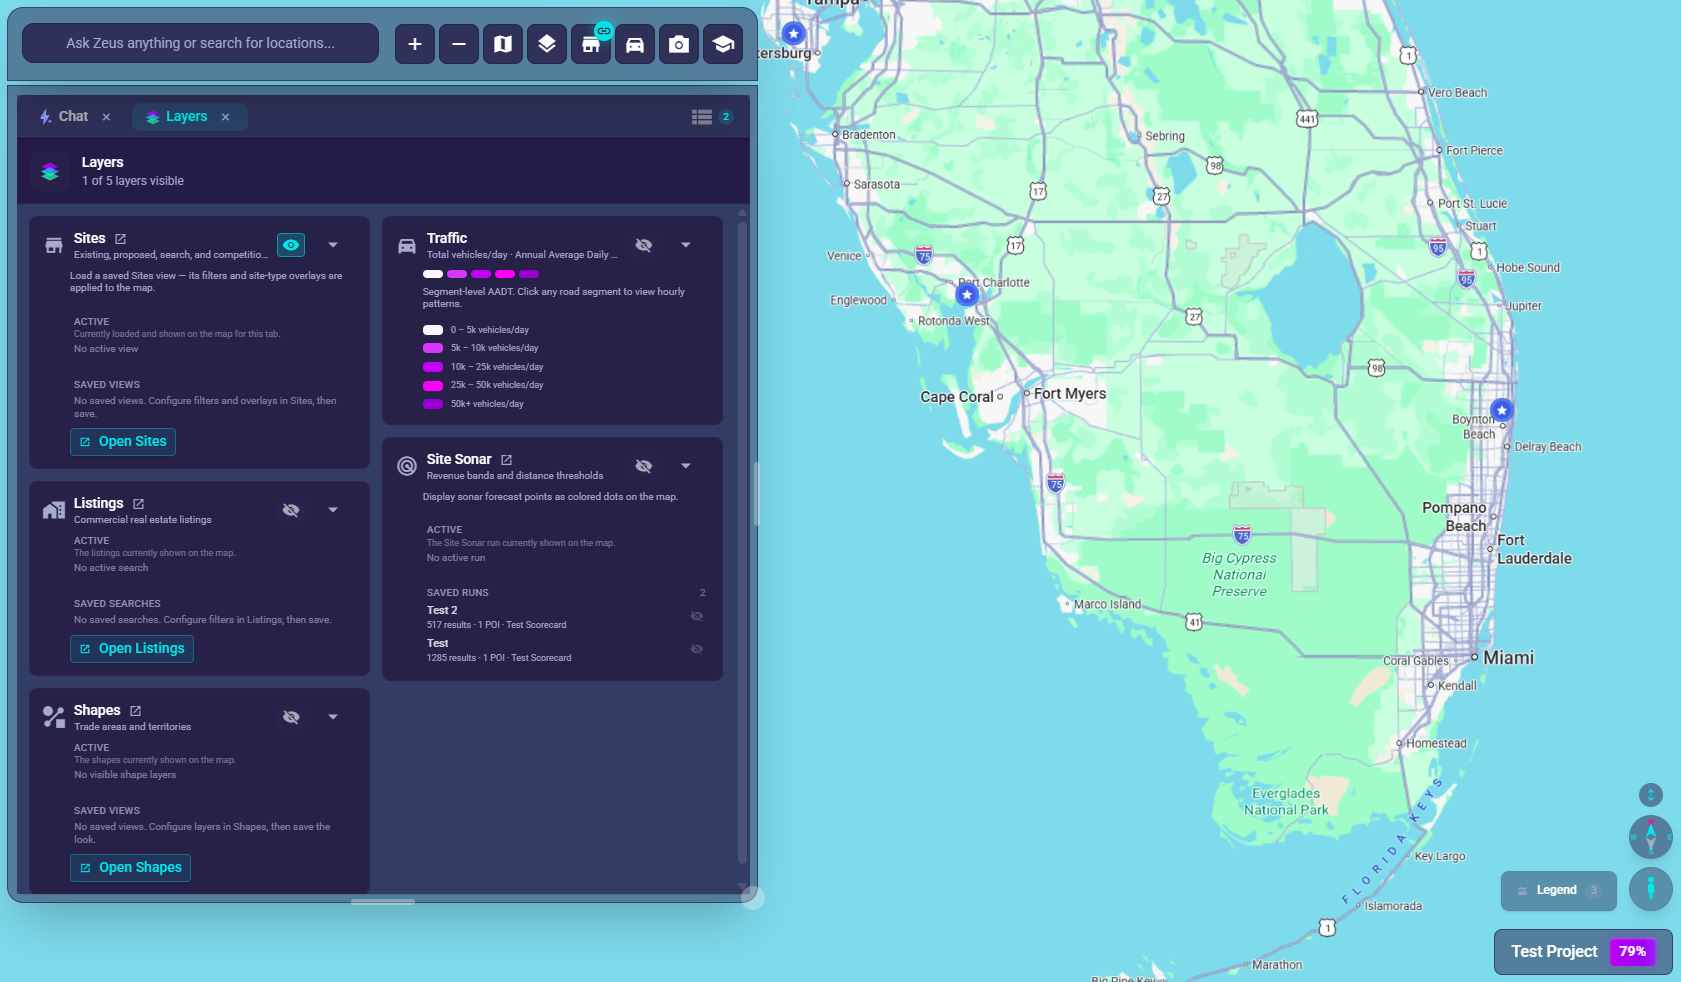
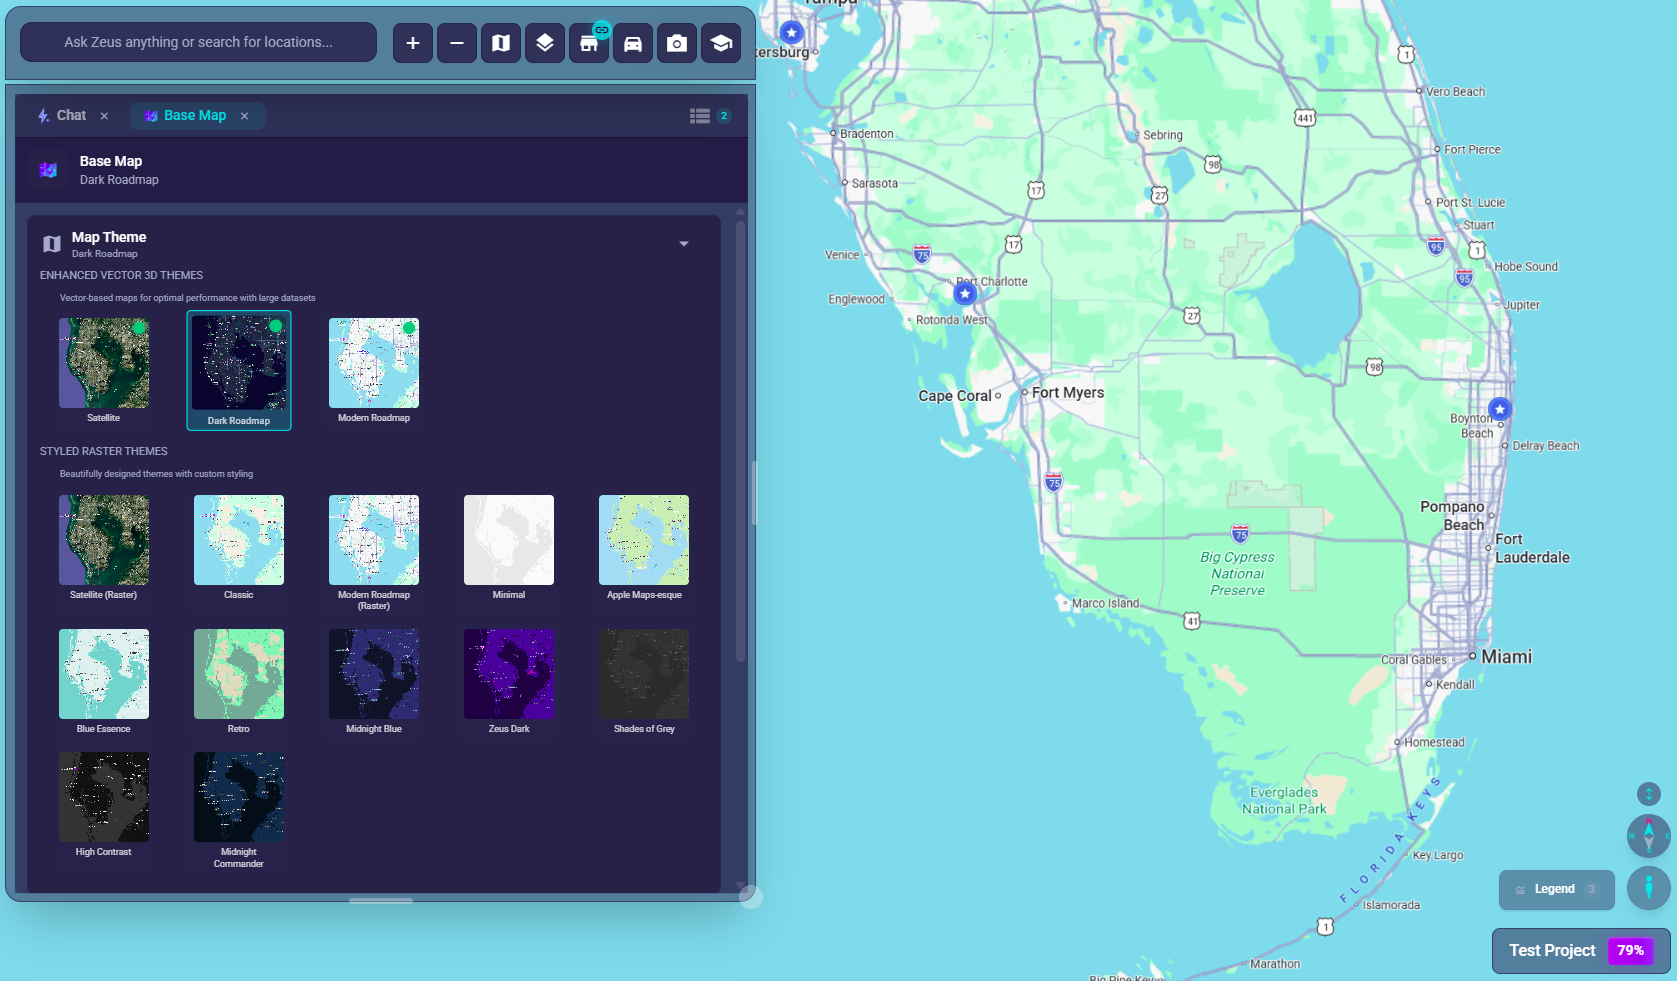
Zeus.ai has two independent map-settings tabs, each opened by its own chat-bar button: the Layers tab (site visibility and workspace overlays) and the Base Map tab (Google Maps data layers, themes, and map features). Site-type visibility, popups, and clustering live in the Sites tab.
Where to Find Layer Controls
- Click the Layers button (
layers📚) in the chat bar to open the Layers tab, showing Site Sonar and Shapes overlays plus your active/saved Sites views - Click the Base Map button (
map🗺️) in the chat bar to open the Base Map tab, showing map theme, data layers, and map features - Click the Sites button (
store🏪) in the chat bar for site-type visibility, popup settings, and Smart Clustering
Site Layers (Sites Tab)
Site-type visibility, popup settings, and Smart Clustering now live in the Sites tab (store icon in the chat bar), not the Layers tab.
Sites Section
The Sites section (in the Sites tab) groups site visibility and popup controls in one place:
- Visibility toggle (eye icon): Shows/hides all site types without clearing your individual selections.
- Collapse caret: Collapse or expand the full Sites section to reduce clutter.
- Site type lists: Existing, Proposed, Sites of Interest (Layer), and Search.
- Popup display settings: Per-category popup visibility, connector line style, revenue grade pill, and attribute selection (gear icon in category rows). Pinned popups can be dragged, resized, and reset to auto layout after manual adjustments.
- Zeustimate pill on proposed-site popups: When you pin a proposed-site popup that has a Zeustimate value, a separate Zeustimate revenue-grade pill renders alongside the standard revenue pill. It uses the same color and grade scheme as the rest of the popup so you can compare the modeled estimate against the displayed revenue at a glance.
Smart Clustering and Cluster Radius are also in the Sites tab — see Location Clustering for full details. The Layers tab itself is limited to your active/saved Sites views plus the Site Sonar and Shapes overlays below.
Available Site Type Categories
| Category | What It Contains |
|---|---|
| Existing Sites | Your operating locations (Mature, New, Non-Traditional, Closed) |
| Proposed Sites | Planned locations (Consideration, Approved, LOI, In Development) |
| Sites of Interest | Layer locations (competitors, POIs from external data) |
| Search Sites | Temporary pins from search results |
Sites of Interest layer ordering: When a project has multiple Sites of Interest layers, they appear in the Sites tab in ascending layer-ID order. The layer with the lowest ID is labeled layer-1 and receives the first icon color; each additional layer follows in ID order. This same ordering applies wherever per-layer counts are shown, such as in polygon and trade-area analysis views.
How to Use Site Layers
- Click the Sites button (store icon) in the chat bar
- Use the eye icon in the Sites section to quickly hide/show all sites (your per-type choices are preserved)
- Click the checkbox next to a category to show/hide all sites of that type
- Expand a category (click arrow) to see subcategories
- Toggle individual subcategories for fine control (e.g., show only "Mature" existing sites)
- Map updates immediately to reflect your choices
Smart Clustering and Cluster Radius are also in the Sites tab's Sites section — see Location Clustering for full details.
Map Overlay Sections (Layers Tab)
These sections live in the Layers tab below your active/saved Sites views, and use the same visibility eye toggles. The Heat Map overlay shown in earlier versions of this article was retired app-wide and no longer exists.
Site Sonar
- Controls visibility for Site Sonar map results after you run Site Sonar.
- Use this when you want to compare Site Sonar candidates against other visible site layers.
- Turn it off when you want to reduce map noise and focus on the table results instead.
- Saved Site Sonar layers reload through the same overlay, so only one Sonar dataset is active at a time.
Shapes
- Controls Trade Areas and Territories visibility (separate toggles).
- When enabled, shape polygons render as overlays on top of the base map with color, fill, and label styling chosen in the Shapes tab.
- Hovering a shape opens its hover card; clicking selects it and routes deeper analysis to the Shape Analytics tab.
- Use the dedicated Shapes workspace tab for creation, editing, saved selections, and Synergos metadata.
- Territory access: Custom territory sets are only listed when they have been shared with your account. If a colleague's territory does not appear, ask the creator to share it with you from the Shapes workspace. Trade area sets (drive-time and ring polygons) are not subject to per-user sharing and are visible to all project members.
Listings
- Controls the Listings overlay (REsimplifi real estate markers) on top of your sites.
- When enabled, listing pins render on the map and respond to filters set in the Listings workspace tab (transaction mode, price, square footage, property type, attributes).
- Click a listing pin to open its hover card with property details and a Street View preview.
- The overlay only appears when your subscription includes the Listings bundle.
Saved Views Across Map Layers
Site Sonar, Shapes, and Listings each support Saved Views — named filter and selection sets that you can reload from the workspace tab. They share a single accordion control pattern so the behavior carries across map layers:
- Up to five Site Sonar saved layers can be visible on the map at once; the most recently activated becomes the editing target for the results table and Design card.
- Listings and Shapes saved views recall both the filter state and any color or label preferences for the layer.
- All saved views persist per project so your last-used selections are restored when you return.
Layer Toggle Persistence
- Sites, Site Sonar, Shapes, and Listings visibility toggles persist per project so your last-used visibility state is restored when you return.
Google Maps Data Layers (Base Map Tab)
The Base Map tab includes toggles for Google Maps data overlays.
Available Data Layers
| Layer | Icon | What It Shows |
|---|---|---|
| Real-time Traffic | traffic | Current traffic conditions and congestion (red/yellow/green roads) |
| Public Transit | directions_transit | Bus, train, and subway routes with stops |
| Bicycle Paths | directions_bike | Dedicated bike lanes and cycling routes |
How to Enable Data Layers
- Click the Base Map button (map icon) in the chat bar
- Scroll to "Data Layers" section
- Toggle each layer on/off using the checkbox
- Layer overlays appear on the map immediately
Layer Availability Notes
- Traffic: Available on all map themes
- Transit: Available on all map themes
- Bicycle: Available on most themes, not available on Dark Roadmap theme (causes rendering issues)
- Selecting traffic on the map can open the dedicated Traffic tab for deeper segment detail
Map Features (Base Map Tab)
Control which map elements are displayed (available on raster themes only):
Points of Interest (POI) Categories
Toggle visibility of places shown on the Google Maps base layer:
| Category | Examples |
|---|---|
| Businesses | Stores, restaurants, gas stations |
| Parks | Parks, recreation areas |
| Healthcare | Hospitals, clinics, pharmacies |
| Government | Government buildings, offices |
| Attractions | Tourist spots, landmarks |
| Schools | Schools, universities |
| Worship | Churches, mosques, temples |
Use the "All POIs" master toggle to quickly show/hide all categories.
Map Elements
Toggle core map features:
| Element | What It Controls |
|---|---|
| Roads | Highways and local roads (each with its own sub-toggle) |
| Water | Rivers, lakes, oceans |
| Road Labels | Street names |
| Place Labels | Named places on the map |
| Map Icons | Small icon glyphs on the base layer |
| Parks | Park and recreational area fills |
| Transit Labels | Bus/train/subway stop and line names |
| Boundaries | Country and state/province borders |
| Terrain Features | Natural land features (not available on satellite) |
Vector Map Note
If you're using a Vector theme (Dark Roadmap, Satellite Vector):
- POI and map element controls are not available
- Vector maps use cloud-based styling
- Traffic, Transit, and Bicycle layers still work normally
Combining Layers Effectively
Good Combinations
| Analysis Goal | Recommended Layers |
|---|---|
| Site accessibility | Traffic + Transit + Your locations |
| Competition analysis | Existing Sites + Layer Sites (competitors) |
| Market gaps | Site Sonar + Proposed Sites + POIs |
| Real estate sourcing | Listings + Proposed Sites + Traffic |
| Trade-area analysis | Shapes (Trade Areas) + Existing Sites + Demographics |
| Dense map cleanup | Smart Clustering + only the site groups you need |
Avoid Overload
- Too many layers = visual noise and slow performance
- Enable only what's relevant to your current task
- Turn off layers when done analyzing
Performance Considerations
Layer Impact on Speed
| Layer Type | Performance Impact |
|---|---|
| Site type filters | Minimal - just hides/shows markers |
| Traffic overlay | Low - Google handles rendering |
| Transit overlay | Low - Google handles rendering |
| Bicycle overlay | Low - Google handles rendering |
| Many POI categories | Medium - more elements to render |
Tips for Best Performance
- Enable clustering when you have 100+ locations
- Turn off unused layers when not actively analyzing
- Zoom to your area of interest before enabling heavy layers
- Use Vector themes for large datasets (better performance)
Live Map Legend
When overlay layers are active on the workspace map, a collapsible Legend panel appears on the map. The panel is collapsed to a small header by default, showing the legend icon and the count of active overlay entries.
Desktop: The legend appears in the bottom-right corner of the map. Click the legend header to expand the panel and see each active overlay layer with its color swatch or gradient. Click the header again to collapse. The legend is hidden when no overlay layers are active.
Mobile: A Legend pill appears below the project name in the mobile top bar. Tap it to open the full legend in a bottom sheet.
Overlay layers that appear in the live legend:
| Overlay source | Legend entry shown |
|---|---|
| Shapes (polygons) | Shape name with its color |
| Site Sonar saved layers | Saved layer name with its color |
| Mobile Data - Optimal Geospace | "Optimal Geospace" with its color swatch |
| Mobile Data - Path-to-Purchase | "Path-to-Purchase" with its color swatch |
| Mobile Data - Evening locations | "Evening locations" with its color swatch |
| Mobile Data - Daytime locations | "Daytime locations" with its color swatch |
| Traffic (AADT) | "Traffic (AADT)" with a Low-to-High color gradient |
| Listings | "Listings" with its green swatch |
Site pins (existing, proposed, layer markers) are not included in the live legend in this release. Their visibility is controlled per layer in the Sites tab.
Layer Legends
Understanding Colors
Traffic Layer:
- Green = Free flow, no delays
- Yellow = Moderate traffic
- Orange = Heavy traffic
- Red = Severe congestion
Transit Layer:
- Lines show routes
- Icons indicate stops/stations
- Colors may vary by transit type
Site Markers:
- Colors indicate status category (see Markers and Icons)
- Clusters show count numbers
Troubleshooting
Layer Not Appearing
- Check if toggled on in the Layers or Base Map tab (or the Sites tab, for site-type layers)
- Zoom in - some layers only appear at certain zoom levels
- Check theme compatibility - some layers don't work on all themes
- Refresh the page if changes don't apply
Layer Looks Wrong
- Zoom in/out to trigger refresh
- Check if data exists for your geographic region
- Clear browser cache and reload
Performance Issues
- Turn off unused layers
- Enable Smart Clustering for your site markers
- Zoom to a smaller area
- Switch to a Vector theme for better performance
What the AI can do for you with this
Zeus.ai Chat can toggle most of the layers documented above and run analytics against the shapes drawn on top of them. Capabilities (catalog names):
- Map & App Control (
mapControl) — turn the traffic, transit, or bicycle layers on/off; switch basemap themes; focus a workspace tab; zoom to a region. - Shape, Territory & Trade-Area Analytics (
shapeAnalytics) — run demographics, mobile data, and competition analysis against any drawn trade-area polygon or territory. - Site Sonar (
getSonarResults) — surface the Site Sonar layer's candidate set when you ask about it in chat. - Search, Resolve & Pin Locations (
searchLocations) — drop a search pin to add a candidate to the map without saving a site. - Traffic Analysis (
getTrafficInfo) — pair the traffic basemap layer with segment-level vehicle counts for a selected site.
Worked example
"Switch to satellite and zoom to our Texas stores."
The agent uses mapControl to change the basemap theme and re-center the map. Follow up with "Now turn on the traffic layer" and a second mapControl call toggles the data layer. Both prompts are pinned by probe-scenarios/executive-summary.mjs (mixed frontend/backend chain).