
Appearance
Using Impact Analytics
Quick Answer
Impact Analytics estimates how a proposed site would affect revenue at nearby existing stores in your portfolio. Open Location Analytics on a proposed site, scroll to the Impact Analytics section, review the auto-selected nearby stores (within 10 miles, expanded to 50 if fewer than 10 are found), then click Run Impact to see per-store percent and dollar impact, total trip counts, and an optional map overlay of the impact prediction. The section is only available on proposed sites and requires mobile-data coverage on the nearby stores.
What Impact Analytics Does
Impact Analytics runs a study-v2 against your project to predict how visits and revenue from nearby existing sites would shift if the proposed site opened. For each selected nearby store, it returns:
- A transfer rate — the share of trips that would re-route to the proposed site.
- A total trips count — the volume of trips behind that transfer rate.
- A percent impact on the store's revenue.
- A dollar impact computed from the store's recorded revenue.
The study output also feeds a map overlay that paints the geographic distribution of expected impact, anchored to one of three coordinate sources (the visit's last stop, the visitor's common evening location, or the visitor's common day-time location).
Where to Find Impact Analytics
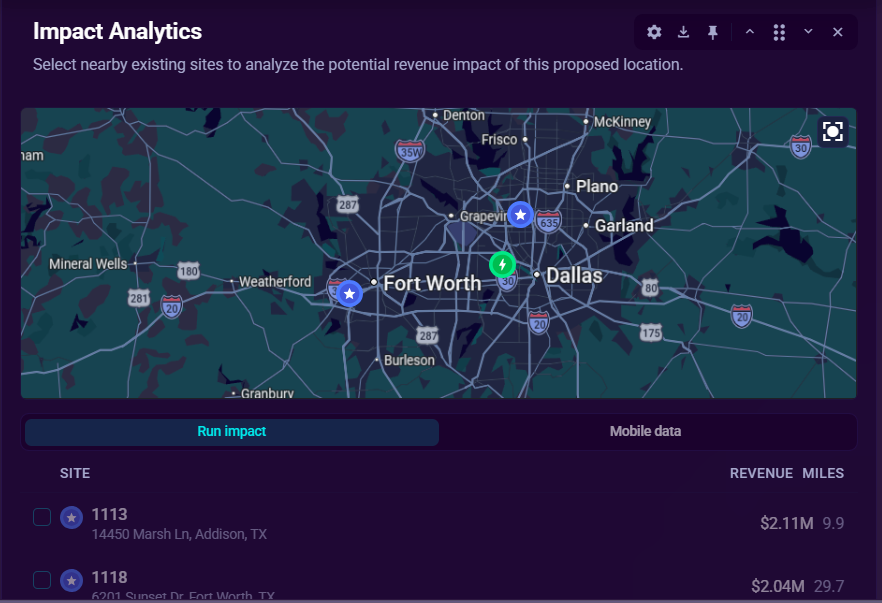
- Select a proposed site on the map (Consideration / Approved / In Development).
- Location Analytics opens automatically.
- Scroll to the Impact Analytics section.
The section is hidden on existing sites — it only renders when the selected site is proposed.
Via a deep link from the Impact App
Clicking a proposed site inside the Impact App opens SiteZeus, selects that site's Location Analytics, and scrolls directly to the Impact Analytics section. No manual navigation is needed.
If the link cannot resolve the site — because the site was removed, the project changed, or the link is stale — SiteZeus opens the project map without selecting a site.
How It Works
Step 1 — Nearby Store Discovery
The panel finds candidate stores around the proposed site by querying the server:
- First pass: every existing site within 10 miles is included.
- Fallback: if fewer than 10 sites land inside 10 miles, the search expands to 50 miles and the closest 10 are kept.
Permanently closed sites are excluded from the candidate list automatically.
Step 2 — Auto-Selection of Ready Stores
As soon as nearby stores are discovered, the panel auto-selects up to the maximum allowed (10 stores) from the candidates that have a completed Impact v2 pipeline run. This lets you click Run Impact without manually picking stores in the common case.
Each row shows the store name, site-type icon, and address. When a mobile-data pull has been recorded for a store, a small badge also appears showing the date of the last pull (for example, 5/7/26). Use this badge to judge how current the underlying mobile data is before committing to a study. Stores with no recorded pull show no badge.
If you want a different selection:
- Click any row to toggle it on or off.
- Rows that cannot participate in a study are disabled. Hover over a disabled row to see why:
- "No mobile data available" — the store has no mobile-data record.
- "Mobile data pull errored" — the store has a mobile-data record but its most recent data pull ended in an error. Open that store's Mobile Data panel and click Refresh — a re-pull after a failed pull is free and costs no license.
- "Mobile Data needs refreshing" — the store has mobile data but no completed Impact v2 pipeline run (the data predates the v2 rollout, or the most recent v2 run failed). Use Refresh in that store's Mobile Data panel to trigger a new v2 run.
- "Impact data not yet ready" — a v2 pipeline run is currently in progress for this store. Check back shortly; the row becomes selectable once the run completes.
- Rows past the maximum are disabled with a "Maximum sites selected" tooltip.
You need at least one selected store to enable the Run Impact button.
Step 3 — Run the Study
Click Run Impact to call the project's impact-analytics/study-v2 endpoint with the proposed site and your selected stores. The study can take roughly 5-15 seconds. While it runs, the panel shows a "Running impact analysis…" placeholder. On failure, an error pane appears with a dismiss control.
Step 4 — Review Results
The results view shows a per-store table:
| Column | What it shows |
|---|---|
| Store | Name and site type icon |
| Revenue | The store's recorded revenue |
| % Impact | Percent of revenue expected to transfer to the proposed site, color-coded to match that store's map marker and legend color |
| $ Impact | Dollar value of that transfer |
| Total Trips | Total observed trips backing the prediction |
A Sum row at the bottom totals the dollar impact across the selected stores.
Hiding Stores From the Results
You can hide an individual store from a completed results table when you want to exclude it from the picture. A hidden store is removed from the table entirely (it is not dimmed or struck through), and the Sum row recalculates to reflect only the stores still visible. If you hide every store, the table shows a "No stores included in this analysis" empty state.
Hiding is a temporary view filter, not a saved setting:
- Click Show all beneath the table to bring every hidden store back.
- Reloading the page also restores all stores — hides do not persist across sessions.
- Toggling the Map Overlay keeps your current selection; only the visible stores are painted on the map.
A frozen report or shared link keeps whatever set of stores was saved when the report was generated, so hiding stores in a live session does not change an already-generated report.
Step 5 — Focus Mode
Click any row to focus on a single store. The other rows dim, and the map overlay re-renders to show only that store's predicted impact contribution.
Focus mode uses each row's siteVisited attribution returned by study-v2, so the map updates isolate the right store rather than re-coloring all rows. Click show all under the table to clear focus.
Step 6 — Map Overlay (Optional)
Toggle Map Overlay on to paint the impact prediction over the map. With the overlay enabled, choose a Location source:
- Last Stop — origin of the trip immediately before the visit (visualization type 0).
- Common Evening Location — visitor's residential anchor (visualization type 1).
- Common Day-time Location — visitor's workplace anchor (visualization type 2).
The color legend beneath the toggle maps each store color to its row in the table.
Back to Selection
Click Back to site selection to return to the store-picker view. Re-running a study clears the previous result.
Display Options
The Impact Analytics section has a gear icon accessible from the section header hover controls. Clicking it opens a Display Options popover with two settings:
Show Map
When Show map is on, an embedded mini-map appears above the impact table. It shows:
- A proposed site pin at the coordinates of the selected proposed site.
- Existing site pins for the nearby stores included in the study — rendered with the same icon the map uses for each site's type and category.
Show Map is off by default. Enabling it opens a Base map selector (Performance or Styled themes). The chosen basemap is saved per-view alongside the section's other display settings.
In a frozen report viewer or shared link, the map renders from the payload captured when the report was generated. In headless PDF / deck export, a static map image replaces the live interactive map.
Transfer Threshold (admin)
If your account has permission to adjust the Impact Analytics transfer threshold, an additional row appears in the popover linking to the transfer threshold settings dialog. This row is hidden for users without that permission.
Use Cases
- Cannibalization analysis — Quantify how much of a proposed site's projected revenue is pulled from existing stores rather than newly captured.
- Site short-listing — Compare a few candidate proposed sites by how much they impact your portfolio, all else being equal.
- Network design — Decide whether to densify in a market (accepting transfer) or expand into a fresh trade area.
Section Mini-Map
The Impact Analytics section includes an embedded mini-map that is on by default. The map provides a geographic overview of the proposed site and the nearby existing stores in the analysis.
To configure the mini-map, use the gear icon (Display Options) in the section header:
- Show map — toggle the mini-map on or off.
- Base map — choose a basemap theme (Vector or Raster options).
Settings persist per session. If a study has been run, the mini-map state is also baked into frozen reports.
Tier Gating and Dependencies
- The section requires a proposed site type. It will not render on existing sites.
- The study endpoint requires a mobile-data record and a completed Impact v2 pipeline run on the nearby stores being analyzed. Stores with no record show "No mobile data available"; stores whose pull errored show "Mobile data pull errored"; stores with a record but no completed v2 run show "Mobile Data needs refreshing" or "Impact data not yet ready" depending on their pipeline status. See Mobile Data for how coverage works.
- The Impact Analytics entitlement claim gates the broader feature; the panel surfaces a structured error if the entitlement is missing.
Impact Settings (Transfer Threshold)
The transfer threshold is a project-wide cut-off applied to every Impact study run in the project. Per-store predictions below this threshold are excluded from the results table. The default is 15%. Users with the Company Admin or Support Admin role can override the default per project.
Because the threshold is shared across all users of a project, changing it shifts the Impact results for every team member running studies in that project.
Opening Impact Settings
When you have permission to edit the threshold, a gear icon appears in the Impact Analytics section header. Click the gear to open the Impact Settings dialog.
The gear icon is hidden for:
- Users without the Company Admin or Support Admin role.
- Frozen report viewers and share link recipients.
- While a study is actively running.
Editing the Threshold
- Click the gear icon in the Impact Analytics section header.
- In the Transfer threshold (%) field, enter a value between 0 and 100.
- Click Save.
On a successful save the dialog closes, all cached Impact predictions for every site in the project are cleared, and the panel resets to the site-selection phase. The next run uses the new threshold.
The Reset to default button clears the project override and restores the 15% default. It is disabled when no project override is active.
Effect on Results
Raising the threshold applies a stricter cut-off, excluding more per-store predictions. Lowering it applies a looser cut-off, including more. Because one save affects every Impact study in the project, all cached predictions are discarded when the threshold changes. After saving, pick your stores and click Run Impact again to see results under the new threshold.
Reports and Share Links
When a real study has been run, Impact Analytics results are baked into the frozen report payload at generation time. Report viewers and share link recipients see a read-only results table — the per-store percent and dollar impacts, total trip counts, and the sum row — with no live study-v2 call. This means the block renders correctly for anonymous share link recipients who do not have an active session.
The read-only frozen view omits the interactive controls: site selection, map overlay, focus mode, and the Back to site selection button. Those controls require a live session and are hidden in the report viewer.
If no study was run before the report was generated — or if the proposed site coordinates changed after the last run — the Impact Analytics block shows an empty state with the message "Impact analysis isn't available in this shared view." Open the proposed site in the workspace, run the study interactively, then regenerate the report. Other report sections are unaffected.
To include Impact Analytics results in a report:
- Open the proposed site and run the study interactively.
- Once the results table appears, generate or re-run the report.
If you want a different set of stores reflected in the report, run the study again with the desired selection, then regenerate the report.
Tips
- Trust the auto-selection on first run. It picks stores with a completed Impact v2 pipeline run, ordered by proximity. Re-pick only when you want to focus on a specific subset.
- Check the last-pull date badge before running. Each eligible store row shows the date its mobile data was last refreshed (for example,
5/7/26). If the badge is stale or absent, the data backing the study may be older than expected — use Refresh in that store's Mobile Data panel to re-pull it. - Use focus mode to debug surprises. If a row shows an unexpected dollar impact, click it and inspect its map overlay slice — it will reveal whether the impact is geographically concentrated or diffuse.
- Switch the map overlay's Location source between Last Stop / CEL / CDL to compare three different views of where the impact is coming from.
- Run a second study by clicking Back to site selection and toggling a different store set. The previous results are cleared so the next run is unambiguous.
- Adjust the transfer threshold when the default 15% cut-off does not fit your brand. If you are a Company Admin or Support Admin, open the gear icon in the section header and enter the percent that matches your typical transfer rate. Lower the threshold to capture more predictions; raise it to focus on stores with a stronger predicted transfer. The change applies to all users and all sites in the project, and all cached results are cleared on save.
Common Pitfalls
"Couldn't load nearby sites"
The server returned an error while fetching candidate stores. Click Retry to try again. If the problem persists, check your network connection or contact support.
"No existing sites nearby"
There are no existing sites within 50 miles of the proposed location, so no study can be run. Add more existing sites or pick a different proposed site.
Some nearby stores are disabled with "No mobile data available"
Those stores don't have mobile-data coverage and can't participate in a study. Either replace them with eligible stores, or open each disabled store's Mobile Data panel and click Request mobile data to queue a pull (this consumes one Mobile Data license per site). If your account has no licenses remaining, contact your SiteZeus account team.
Some nearby stores are disabled with "Mobile data pull errored"
The store has a mobile-data record but its most recent data pull ended in an error. This is distinct from "Mobile Data needs refreshing" — the pull itself did not complete successfully. Open that store's Mobile Data panel and click Refresh. Because the last pull failed, this re-pull is free and consumes no license.
Some nearby stores are disabled with "Mobile Data needs refreshing"
The store has mobile-data coverage but its Impact v2 pipeline has no completed run — either the data was acquired before the v2 rollout, or the most recent v2 run failed. Open that store's Mobile Data panel and click Refresh to re-pull it, which triggers a new v2 pipeline run. The row becomes selectable once the new run completes.
Some nearby stores are disabled with "Impact data not yet ready"
A v2 pipeline run is actively processing for this store. Check back in a few minutes; once the run finishes, the row becomes selectable and the store will be included in auto-selection on your next visit.
"Maximum sites selected"
You've hit the 10-store ceiling. Deselect a store before adding another.
Study failed
The "Impact analysis failed" pane shows the underlying error. Dismiss and retry; if the error persists, capture the message and contact support.
The Impact Analytics block is empty in a generated report
The study was not run before the report was generated, or the proposed site coordinates changed after the last run. Open the proposed site, run the study in the active workspace, then regenerate the report. Once a study has run, re-generating the report bakes the results into a read-only block visible to all viewers.