
Appearance
Using Mobile Data
Quick Answer
The Mobile Data section shows the true trade area of a location based on real visitors over the last 12 months, derived from UberMedia mobile-device observations. It packages four products — Optimal Geospace (OGS), Path-to-Purchase (P2P), Common Evening Locations (CEL), and Common Day-time Locations (CDL) — into a stacked panel inside Location Analytics and is also available as an agent rich-card in chat.
What Mobile Data Is
Mobile Data is sourced from UberMedia and reflects observed device activity in the vicinity of a site over a 12-month rolling window. Each product answers a different question about real visitors:
| Product | What it answers |
|---|---|
| Optimal Geospace (OGS) | What polygon set captures the site's actual trade area, by visit retention? |
| Path-to-Purchase (P2P) | Where did visitors come from immediately before visiting? |
| Common Evening Location (CEL) | Where do those visitors live? (residential anchors) |
| Common Day-time Location (CDL) | Where do those visitors work? (workplace anchors) |
These are observational outputs, not model predictions. They reflect what devices actually did, not what a Zeustimate-style forecast expects.
Where to Find Mobile Data
On the Map (Filter Chip)
The Sites tab filter panel includes a "Sites with mobile data" chip. When you enable it, the map and the Sites list narrow to show only sites with mobile data coverage. This is a quick way to identify which of your locations have Mobile Data available before opening each site's analytics.
See How to Filter Locations for full details on using this filter.
In Location Analytics
- Select a site on the map.
- Location Analytics opens automatically.
- Scroll to the Mobile Data section.
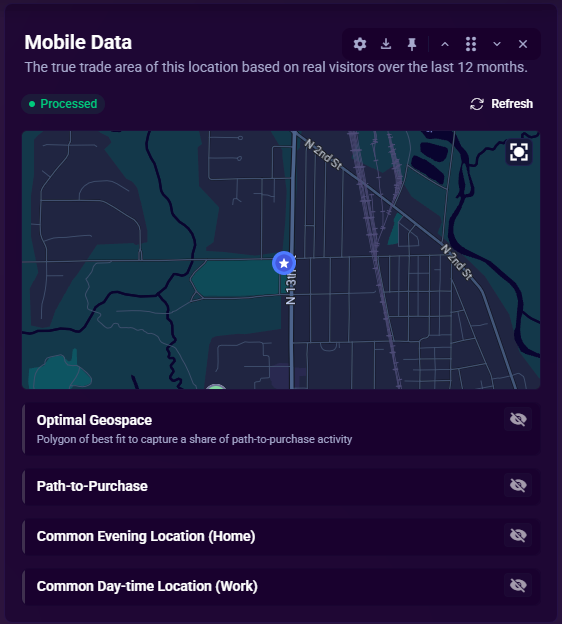
The section shows:
- A header with the site description.
- A stacked column of product cards (OGS, P2P, CEL, CDL) — in that intentional order, with OGS at the top as the headline output.
- Each card has a colored 3px left rail that stays in sync with the corresponding map layer's hue and visibility, so you can see at a glance what's painted on the map.
As an Agent Rich-Card
When you ask the chat agent for mobile data on a site (for example, "show me mobile data for the Wawa on Main Street"), the agent emits a portable Mobile Data card directly in the conversation. The card embeds the same MobileDataPanel you'd see in Location Analytics, so all four products load and behave identically.
The chat card registers the site with the workspace's mobile-data store on mount, so its map layers stay visible while the card is open in the conversation, and they're cleaned up when the card scrolls out or the thread is closed.
Display settings you adjust on the chat card (such as which product cards are visible or which OGS retention rings are active) are saved independently for the chat context and persist across sessions. Changes you make in the chat card do not affect your analytics tab display settings, and changes in the analytics tab do not affect the chat card. Each context remembers its own preferences separately.
Product Cards
Each product card has a consistent layout:
- A header with the product name, a one-line summary, an on-map visibility toggle, and an expand/collapse caret.
- A body that loads on demand — click Load the first time you open a product for a site, then switch the on-map toggle to paint it on the map.
- A colored hue indicator on the left rail and on the map layer so the panel and map stay in sync.
Optimal Geospace (OGS)
OGS produces a concentric ring set of polygons that describe the actual trade area at different visit-retention thresholds. The card body shows the ring set and a row of retention pills you can toggle to focus on individual rings (for example, only the high-retention core).
Use OGS when you want a real trade-area polygon for the site that you can compare against ring/drive-time trade areas elsewhere in Zeus.ai.
Path-to-Purchase (P2P)
P2P shows visit-density observations of where devices came from immediately before the visit. The card body renders a GeoJSON layer with the visit-density heat, plus analytics filter controls:
- Metric — toggle between unique devices and total visits.
- Day of week — select one or more days (Mon–Sun chips); defaults to all days.
- Time of day — a dual-handle slider that selects a contiguous window within a single calendar day (midnight through 11 PM). The slider does not wrap around midnight, so overnight ranges such as "11 PM to 2 AM" cannot be selected. To capture late-night visit patterns, use the full-day default or consult OGS for the overall trade area.
Use P2P to understand pre-visit corridors and validate trade-area assumptions against actual movement.
Common Evening Location (CEL) — Home Anchors
CEL anchors each observed visitor to their residential location (estimated as the device's most common evening location). On the map, CEL anchors render as circles. The card body shows:
- Hero stats — visitor counts and ratios.
- A state/metro donut showing where visitors live (Metro view depends on ZIP-to-MSA enrichment and may be disabled).
- A distance-to-home histogram.
Use CEL to answer "who actually lives in this site's trade area?" and to compare visitor origins across candidate sites.
Common Day-time Location (CDL) — Work Anchors
CDL mirrors CEL but uses each device's most common day-time location as a workplace anchor. On the map, CDL anchors render as squares — CEL and CDL share the same color family for a site, so the circle-versus-square shape is what tells home anchors from work anchors apart. The card body uses the same layout as CEL (hero stats, state/metro donut, distance histogram), so additions to one product surface on both.
Use CDL to spot daytime catchment patterns that may differ from where visitors live (for example, an office-dense daytime market with a suburban evening market).
Section Settings
Click the gear icon on the section header (from the Location Analytics floating section-control strip) to open the Mobile Data display options. You can:
- Show map — toggle an embedded mini-map showing the subject site pin and its active OGS retention rings. When Show map is on, a Base map selector lets you choose from Performance (lightweight vector styles) or Styled themes. The map stays hidden while OGS data is loading or when no retention data is available, and it is only drawn when the OGS product card is visible. Show map is off by default so the panel does not boot a map context on every site automatically.
- Show or hide each of the four product cards independently.
- Control which retention rings are active for OGS.
- Configure the P2P analytics request without leaving the panel.
- Show or hide the section mini-map (on by default). When OGS data is loaded, the mini-map renders the OGS trade-area rings alongside the subject pin. Toggle Show map off if you prefer the panel without the embedded map.
- Base map — choose a basemap theme (Vector or Raster options) for the mini-map.
Visibility settings are per-section and persist across sessions.
Tier Gating
Mobile Data is bundle-gated:
- The section is visible whenever the analytics tab has a project context — the panel always renders so users see a parallel surface regardless of which entitlements they hold.
- Per-product data access is gated server-side. If your subscription doesn't include the Mobile Data bundle, the panel surfaces a structured "Mobile Data is not included in your plan" empty state. Clicking Talk to your account team in that state opens a pre-addressed email to
support@sitezeus.comwith the bundle name in the subject line for easy routing. - The PersonaLive subscription claim gates the related Customer Insights surface and unlocks PersonaLive demographic segments on shape analytics; PersonaLive is distinct from the Mobile Data bundle, though many plans bundle them together.
If a site has no mobile-data record acquired yet, the panel shows a "No mobile data for this site" empty state with a Request mobile data button (see below).
Requesting and Refreshing Mobile Data
You can acquire or re-pull mobile data for a single site directly from the panel — you no longer have to route the request through your account team.
- Request mobile data — appears in the "No mobile data for this site" empty state, when the site has no record yet. It queues a fresh pull for the site's coordinates.
Once a record exists, the empty state is replaced by an action bar at the top of the Mobile Data section, holding:
- Refresh — appears when the site already has a record. It retires the current data and re-pulls the latest observations for the same site.
- Status chip — shows the current record's state (for example, Queued, Processing, Processed, or Error). Hover it for the last-updated date and, if a pull failed, the reason.
- Refreshing... — while a re-pull is in flight, the status chip is replaced by a "Refreshing..." badge and the panel keeps showing the previous visualization until the new data is ready.
Both actions open a single confirmation dialog before anything is spent. A new request or a refresh of good data consumes one Mobile Data license — the dialog phrases this as "This uses one mobile data token"; re-pulling a record whose last pull failed is free, and the dialog omits the cost line. Requesting or refreshing requires the Mobile Data bundle and permission to edit mobile data — without a license or the permission, the action is unavailable.
When a freshly built record's visualization first draws on the map, the panel marks it as viewed automatically, so the status advances without any extra click.
Tips
- Start with OGS. The concentric ring set is the most actionable summary — it's the polygon you'd actually use as a trade area in other analyses.
- Toggle on-map visibility per product. The panel and the map layers are kept in sync via the hue rail, so you can quickly paint just the layers you need.
- Use the chat rich-card for one-off comparisons. Asking the agent for mobile data on a few candidate sites is faster than opening each site's analytics tab.
- Watch the load state. Each product loads independently (P2P, CEL/CDL can fail in isolation while OGS succeeds). The card's error chrome highlights the failure without bringing down the rest of the panel.
Common Pitfalls
"No mobile data for this site"
The site doesn't have a mobile-data record yet. If your plan includes the Mobile Data bundle and you have available licenses, click Request mobile data in the panel to queue a pull for the site; the card populates automatically once the visualization is built. If you don't have the bundle or are out of licenses, contact your SiteZeus account team.
"Mobile Data is not included in your plan"
Your subscription doesn't include the Mobile Data bundle. Click Talk to your account team in the empty state to open a pre-addressed email to support@sitezeus.com for bundle inquiry, or contact your SiteZeus account team directly.
Coordinates don't match an existing record
The mobile-data queue is indexed by lat4 / long4 — latitude and longitude truncated (not rounded) to four decimal places. If a site's coordinates were edited after acquisition, the queue may not match. Verify the site coordinates against the recorded lat4/long4. When you move a site that already had mobile data, Zeus.ai re-pulls mobile data for the new coordinates automatically (this can spend a Mobile Data license).
One product is loading while others succeed
That's intentional. Each product (OGS, P2P, CEL/CDL) loads and can fail independently so a slow or unavailable backend for one doesn't block the others. The card hue rail and the section's error chrome will reflect the per-product state.