
Appearance
Compare Projects
Quick Answer
The Compare Projects page lets you select one or more projects and compare how closely each project's Zeustimate predictions match actual site performance. It is available from the sidebar under Project Management > Compare Projects. Compare Projects is an Enterprise feature — accounts on lower tiers do not see the sidebar entry, and the page is not reachable directly.
Getting There
- Open the sidebar (left edge of any project page).
- Under the Project Management group, click Compare Projects.
- The page opens at
/model-accuracy. To pre-select a specific project on load, use a direct link:/model-accuracy/:projectId.
Selecting Projects
The Select Projects card at the top lists every project your account can access.
- Search by project name or company name to narrow the list.
- Check a project row to add it; uncheck to remove it.
- The list renders up to 200 matching rows at a time. If your search returns more, a note at the bottom tells you how many were truncated — refine your search to reach hidden results.
- The percentage on each row is that project's Synergy Power Score — a project-level signal, not its model accuracy.
- Click Clear (appears when at least one project is selected) to deselect all.
Each selected project appears as a side-by-side column.
Reading a Project Column
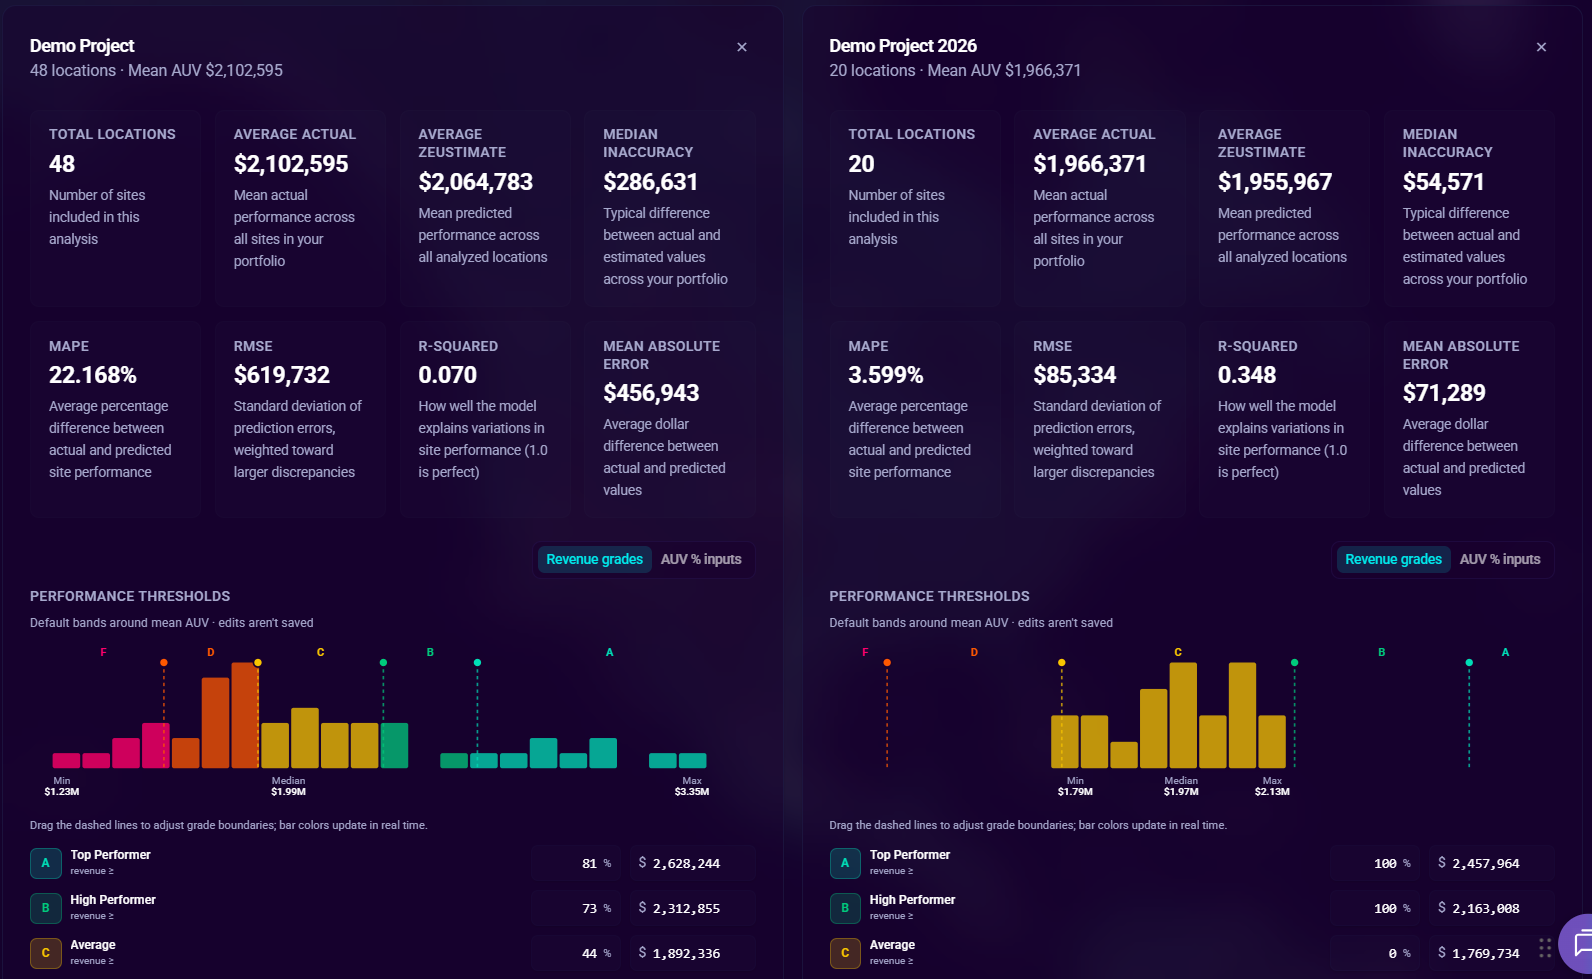
Each selected project is displayed as a separate column card. Columns can be removed individually with the X button in the card header.
Accuracy Metric Cards
Eight summary statistics appear at the top of each column:
| Metric | What it shows |
|---|---|
| Total Locations | Number of sites included in the analysis |
| Average Actual | Mean actual performance across all sites in the portfolio |
| Average Zeustimate | Mean predicted performance across the analyzed locations |
| Median Inaccuracy | Typical dollar difference between actual and estimated values |
| MAPE | Mean absolute percentage error — average % gap between actual and predicted |
| RMSE | Root mean squared error — standard deviation of prediction errors, weighted toward larger gaps |
| R-Squared | How well the model explains variation in site performance (1.0 = perfect fit) |
| Mean Absolute Error | Average dollar difference between actual and predicted values |
A value of — means the metric could not be computed (for example, MAPE requires at least one site with positive actual revenue, and R-Squared requires at least two sites with varying revenue).
Performance Thresholds
Each column has its own Performance Thresholds editor that sets the four dollar cutoffs dividing that project's sites into the five performance categories. The cutoffs are seeded from the project's Revenue Grades:
- Custom Revenue Grades (fixed dollars) — the saved grade cutoffs are used directly.
- Custom Revenue Grades (percentile) — grade bands computed from this project's accepted-model site revenues.
- No custom grades — default bands around the project's mean AUV (roughly −25% / ±10% / +25%).
Adjust any cutoff in place to explore different bands; the category ranges and matrix update immediately. These edits stay on this page — they are never saved back to the project's Revenue Grades. Use Reset to return to the seeded values.
Performance Category Ranges
Below the metric cards, the five performance categories are listed with the dollar range each covers for that project. Ranges come from the project's Revenue Grades (or your in-place adjustments), and the colors match the A–F Revenue Grade palette used elsewhere in SiteZeus.
| Category | Color (Revenue Grade) |
|---|---|
| Poor | Red (grade F) |
| Below Average | Orange (grade D) |
| Average | Yellow (grade C) |
| Above Average | Green (grade B) |
| Excellent | Emerald (grade A) |
Bucketing Accuracy Matrix
The 5 x 5 confusion matrix cross-tabulates the actual performance category (rows) against the Zeustimate forecast category (columns) for every site in the project.
- Diagonal cells (actual bucket = forecast bucket) use grade-A emerald — the model bucketed a site correctly.
- Off-diagonal cells are colored by distance from the diagonal, stepping through the Revenue Grade palette: one step away is grade-B green, two steps yellow, three orange, and the far corners grade-F red.
- The header annotation "Would build with SiteZeus" spans the Average, Above Average, and Excellent forecast columns, highlighting sites where the model would have predicted a favorable outcome.
Two summary rates appear above the matrix:
| Rate | Meaning |
|---|---|
| Exact | Share of sites where the model's bucket matched actual |
| Within one bucket | Share of sites where the model was correct or off by one category |
No Model Statistics
If a project column shows "No accepted model statistics with actual revenue," the project does not yet have a completed and accepted Zeustimate model — or its accepted model has no sites with actual revenue to compare. The metrics and matrix cannot be displayed until usable statistics are available.
Comparing Projects
Add multiple projects to see their columns side by side. Each column is independent — it loads its own statistics and buckets its sites using its own Revenue Grades (or your in-place adjustments). This lets you compare prediction quality across franchises, brands, or markets.
Tips
- Start with one project and get familiar with the metric cards before adding more.
- If MAPE is high or R-Squared is low, check Variable Importance for that project's model to understand which factors are driving the gap.
- The thresholds seed from each project's Revenue Grades, so the buckets match how that project is graded elsewhere in SiteZeus. Adjust them in place to explore — your changes here never alter the saved grades.
- The within-one-bucket rate is often the most useful single number: a high rate means even when the model misses, it misses by only one category.
Entitlement
Compare Projects is available on the Enterprise subscription tier. On lower tiers (for example Emerging) the Compare Projects row is hidden from the sidebar and the /model-accuracy route is guarded, so the page cannot be opened. Contact your SiteZeus account team to discuss upgrading.