
Appearance
Variable Importance Explained
See also (agent workflow):
analytics-composition.mdshows how the agent pairs Forecast Drivers with the Zeustimate when a user asks why a forecast came out the way it did.
Quick Answer
Variable Importance shows which factors most influence a location's revenue forecast. An interactive sunburst chart visualizes how different categories and individual variables positively or negatively impact the prediction.
What Is Variable Importance?
Variable Importance tells you:
- What drives the prediction for a specific location
- Which factors matter most in this particular case
- Whether each factor has positive or negative impact
- How categories group related variables
Where to Find Variable Importance
- Select a location on the map
- Open Location Analytics (opens automatically)
- Scroll to the
Forecast Drivers | What Matters Mostsection - Explore the interactive sunburst chart
Understanding the Visualization
Variable Importance can render in two view modes. Switch between them with the View mode toggle in the section's display options.
Diverging View (default)
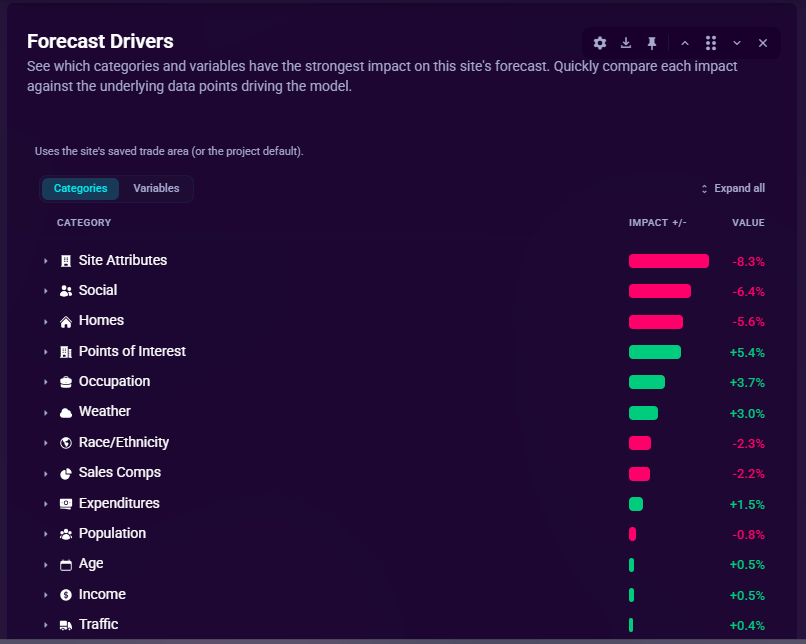
The Diverging view renders variable impact as a list of horizontal bars sorted by importance, with positive (revenue-boosting) and negative (revenue-dragging) impacts laid out on opposite sides of a center axis. This is the default view because the layout makes the relative size of positive vs negative drivers obvious at a glance.
Diverging view options (from the section's display dropdown):
- Bars grouping — show one bar per Variable for fine-grained detail, or aggregate into one bar per Category for a top-down summary.
- Bars sort —
Impact(largest absolute first),Signed(positives first, then negatives), orAlpha(alphabetical). - Bars limit — how many bars to display (default 25; up to 999).
- Bars layout —
Diverging(pos / neg columns split on the center axis) orStacked(single column from zero). - Show zero variables — include variables with 0% impact in the list (off by default).
- Category colors — color the bars and icons by their category instead of by impact sign.
- Show value labels — show the percentage value on each bar.
- AI Variable Impact Summary — toggle the natural-language summary at the top of the section and remember whether its body is collapsed.
The legend table described below is still available alongside the diverging view — toggle it from Show/Hide Legend in the display options.
Sunburst Chart
Switch the view mode to Sunburst to render Variable Importance as an interactive sunburst chart:
- Inner ring: Major categories (Demographics, Traffic, Competition, etc.)
- Outer ring: Individual variables within each category
- Arc size: Represents the importance/weight of each factor
- Colors: Indicate positive (green/cyan) or negative (red/orange) impact
Chart Description
"This interactive visualization shows how different factors influence your revenue forecast based on a random forest model. Explore categories and individual variables to understand their positive or negative impact on location performance."
Navigation
- Click on a category segment to drill down (single click zooms)
- Breadcrumb trail shows your current location in the hierarchy
- Click breadcrumb to navigate back up
- Back to All button appears when zoomed
- Legend shows category colors and impact direction
The Legend Table
The legend table shows detailed information about each variable. You can customize which columns appear and how they're sorted.
Available Columns
| Column | Icon | Description |
|---|---|---|
| Favorite | ❤️ | Heart icon shows if this is one of your favorite variables |
| Rank | # | Position based on impact magnitude |
| Variable Name | — | Variable name with category shown below |
| Net Impact | — | Positive (green) or negative (red) % impact on revenue |
| Abs. Impact | — | Absolute impact magnitude (ignores direction) |
| Typical | — | Average impact this variable has across all sites |
| Correlation | — | How strongly this variable correlates with revenue (%) |
| Site | 📍 | The subject site's actual value for this variable |
| Avg | ⭐ | Average value across all existing mature sites |
| Variance | — | % difference between Site and Avg (▲ above, ▼ below) |
| Distribution | — | Visual bar showing min/max range with site and avg markers |
Sorting Variables
Click on any sortable column header to sort the table:
- # (Rank): Sort by impact magnitude
- Net Impact: Sort by positive/negative impact
- Abs. Impact: Sort by absolute importance
- Typical: Sort by typical impact across portfolio
- Correlation: Sort by revenue correlation strength
- Variance: Sort by how different site is from average
- Favorite (❤️): Group favorite variables at top or bottom
- In Category/Impact views, categories with more favorites rise, and favorites are listed first
Click the header again to reverse sort direction (▲ ascending / ▼ descending).
Clicking Rows
- Category rows: Toggle zoom in/out for the category
- Variable rows: Highlight details only (no zoom)
Favorite Variables
Variables marked as favorites in Demographics appear with a solid pink heart (❤️). Non-favorites show an outline heart. Use favorites to quickly identify your most-watched metrics.
Distribution Bar
The distribution bar provides a visual snapshot:
- Gray bar: Shows the range from minimum to maximum across existing sites
- Circle marker (○): Average across existing mature sites
- Colored dot (●): Your subject site's value
Hover over the bar to see a tooltip with exact values:
- Minimum value
- Maximum value
- Average (with blue star icon)
- Site value (with site icon)
Variance Indicator
The variance column shows how your site compares to average:
- Green ▲: Site value is above average (positive variance)
- Red ▼: Site value is below average (negative variance)
- Percentage: How far above/below average (e.g., +15%, -8%)
Display Options
Use the section controls to customize the display.
Sunburst Chart Options
- Show/Hide Sunburst: Toggle the chart visibility
- Organization Mode:
- Impact: Groups variables by positive/negative impact
- Category: Groups variables by category type
- Top Variable Lines: Show indicator lines for important variables
- Indicator Mode: Highlight Top 5 or Favorite variables
Legend Table Options
- Show/Hide Legend: Toggle the table visibility
- Column Toggles: Show/hide individual columns
- Indicator Style: Use category icons or colored dots
- Show 0% Variables: Include variables with zero impact
Back to All Button Placement
When you drill into a category, the Back to All button is shown:
- Narrow layout (legend below chart): Bottom-left over the chart, just above the legend
- Wide layout (legend to the right): Top-right under the breadcrumb
Reading Variable Importance
Impact Direction
| Color | Meaning |
|---|---|
| Green/Cyan tones | Positive impact on revenue |
| Red/Orange tones | Negative impact on revenue |
| Larger segments | Higher importance/weight |
| Smaller segments | Lower importance/weight |
Category Breakdown
Common categories you might see:
| Category | What It Includes |
|---|---|
| Demographics | Population, income, age, education |
| Traffic | Vehicle counts, commute patterns |
| Competition | Competitor density, distance |
| Location | Site attributes, visibility |
| Consumer | Spending patterns, preferences |
| Economic | Employment, business activity |
Individual Variables
Within each category, individual variables show:
- Specific metrics driving the prediction
- Their relative importance within the category
- Positive or negative contribution
How Variable Importance Works
The Model
Zeus.ai uses a random forest model to predict revenue:
- Analyzes many factors for each location
- Learns which factors correlate with performance
- Calculates how much each factor contributes
- Shows the breakdown in the visualization
Location-Specific
Variable importance is calculated per location:
- Different sites have different drivers
- Urban vs suburban may show different patterns
- Each prediction has unique factor weights
Dynamic Analysis
The visualization shows:
- How the model weighs each factor
- Which factors push revenue up
- Which factors pull revenue down
- The net effect of all factors
Using Variable Importance
For Site Evaluation
- Review the prediction (Zeustimate)
- Check which variables drive it
- Assess if those factors are accurate
- Consider if factors will persist
For Comparisons
- Compare variable importance across sites
- Different sites may have different drivers
- Understand why predictions differ
For Due Diligence
- Verify key drivers - Are they accurate?
- Identify risks - Are drivers stable?
- Validate assumptions - Do factors make sense?
Interpreting Patterns
High Single Factor
If one factor dominates (large segment):
- Prediction relies heavily on this
- Verify this data is accurate
- Consider risk if this factor changes
Even Distribution
If factors are spread evenly:
- Multiple factors support prediction
- More robust estimate
- Less dependent on any single factor
Negative Impacts
If you see red/orange segments:
- These factors are pulling revenue down
- May indicate challenges at this location
- Consider if these can be mitigated
Positive Impacts
If you see green/cyan segments:
- These factors are boosting revenue
- Location strengths
- Leverage in marketing/operations
Tips for Analysis
Focus on Top Factors
- Largest segments matter most
- Don't over-analyze tiny segments
- Understand the big drivers first
Compare to Expectations
- Does importance match your intuition?
- Unexpected factors may reveal insights
- Or may indicate data issues
Consider Context
- Local market conditions
- Specific business model
- Historical performance patterns
Drill Down
- Click into categories for detail
- Individual variables tell the story
- Find actionable insights
Common Variables
Demographics
- Population: People in trade area
- Median Income: Household income levels
- Age Distribution: Population age groups
- Education: Education attainment levels
Traffic & Access
- Traffic Counts: Vehicles per day
- Commute Patterns: Travel behaviors
- Accessibility: Ease of access
Competition
- Competitor Count: Number nearby
- Competitor Distance: Proximity
- Market Saturation: Competitive density
Location Attributes
- Store Size: Square footage
- Visibility: Site visibility
- Format Type: Store format
Limitations
Model-Specific
- Variable importance is for this specific model
- Different models may weight differently
- Specific to your business type
Correlation vs Causation
- Shows correlation, not causation
- Factors that predict, not necessarily cause
- Use business judgment
Data Dependent
- Quality depends on input data
- Missing data may affect results
- Historical patterns may not predict future
Troubleshooting
Section Shows "Couldn't Load Forecast Drivers"
- A dedicated error state appears when the section's fetch fails, distinct from an empty chart when the location has no data.
- Refresh the page to reload the section.
- If the error persists, check your network connection and try again.
Chart Not Loading
- Wait for data to load
- Check if location has analytics data
- Refresh the page if needed
Columns Showing Dashes (—)
- Correlation/Site/Avg columns: Data is still loading, wait a moment
- Legacy sites: Sites created before attribute support may not have full data
- Missing attributes: Some variables may not have all data available
Distribution Bar Not Showing
- Requires minimum and maximum values from existing sites
- May take a moment to load after chart appears
- Not available for variables without comparable site data
Favorites Not Appearing
- Favorites are set in the Demographics section
- Make sure you have favorited variables in Demographics first
- Favorite column must be enabled in Display Options
Unexpected Results
- Verify location data accuracy
- Check for data anomalies
- Consider market-specific factors
Can't Drill Down
- Click directly on segments
- Use breadcrumb to navigate
- Some segments may be too small
What the AI can do for you with this
Variable Importance is the "why" half of the forecast. Capabilities the agent can run from chat (catalog names):
- Forecast Drivers (
getVariableImpact) — return the per-variable contributions (positive and negative) the model used for a specific location. - Revenue Forecast (Zeustimate) (
getZeustimate) — the forecast value that variable impact explains. - Demographic Variable Catalog & Favorites (
demographicsVariables) — inspect or favorite individual variables that surface here. - Search Demographic Variables (
searchDemographicsVariables) — find related variables when you want to dig deeper than the top drivers. - Compare Sites & Shapes (
compareEntities) — line up variable impact across multiple sites to see which factors flip sign between locations.
Worked example
"What drives the forecast at our best store?"
The agent identifies the highest-revenue existing site, then calls getVariableImpact and walks through the top positive and negative drivers. This is one of the canonical quick-example prompts in capability_manifest.json and is exercised by probe-scenarios/multi-skill-chains.mjs.