
Appearance
Generating Reports from Chat
See also (agent workflow):
analytics-composition.mdfor how the assistant decides whether to gather analytics first before generating a report, vs reusing what's already in the thread.
Quick Answer
Ask the assistant to turn existing chat analytics into a report, or select messages and click Generate Report. Reports are created with the Zeus.ai Reporting Framework and produce a shareable web report by default, with PDF and deck outputs available from the same report run when enabled.
What Are Reports?
Reports transform Zeus.ai chat analysis into shareable deliverables. They're useful for:
- Stakeholder presentations - Share insights with executives
- Client meetings - Present site analysis professionally
- Team reviews - Document findings and recommendations
- Executive summaries - Distill complex analytics into key points
Two Ways To Generate A Report
From the Assistant
Use the assistant when the report should be based on the current chat analysis:
- Ask for the analytics you need first, such as an executive summary, demographics, scorecard evaluation, traffic analysis, or Smart Comps.
- Ask for the output: "Create a report from this", "Export this as a PDF", or "Make this a deck."
- The assistant packages the analytics already in the thread. It should not create a report first when the site analytics have not been run yet.
Useful examples:
- "Run an executive summary for this site, then create a report."
- "Get the demographics for this site, then turn it into a PowerPoint deck."
- "Turn this analysis into a shareable report."
- "Send me a PDF of the results above."
- "Make a deck from our discussion."
- "Create a PowerPoint from this analysis."
From Selected Messages
Step 1: Select Messages
- Open the
Chattab in the workspace (or use the chat bar) - Click the checkbox next to messages you want to include
- Select multiple messages to build comprehensive reports
- Messages appear with a checkmark when selected
Chat Messages:
┌────────────────────────────────────┐
│ ☑ You: Show me top 5 locations     │
│ ☑ AI: Here are the top performers  │
│ ☑ You: What's the revenue trend?   │
│ ☑ AI: Revenue is up 15% this year  │
│ ☐ You: Thanks!                     │
└────────────────────────────────────┘
Step 2: Click Generate Report
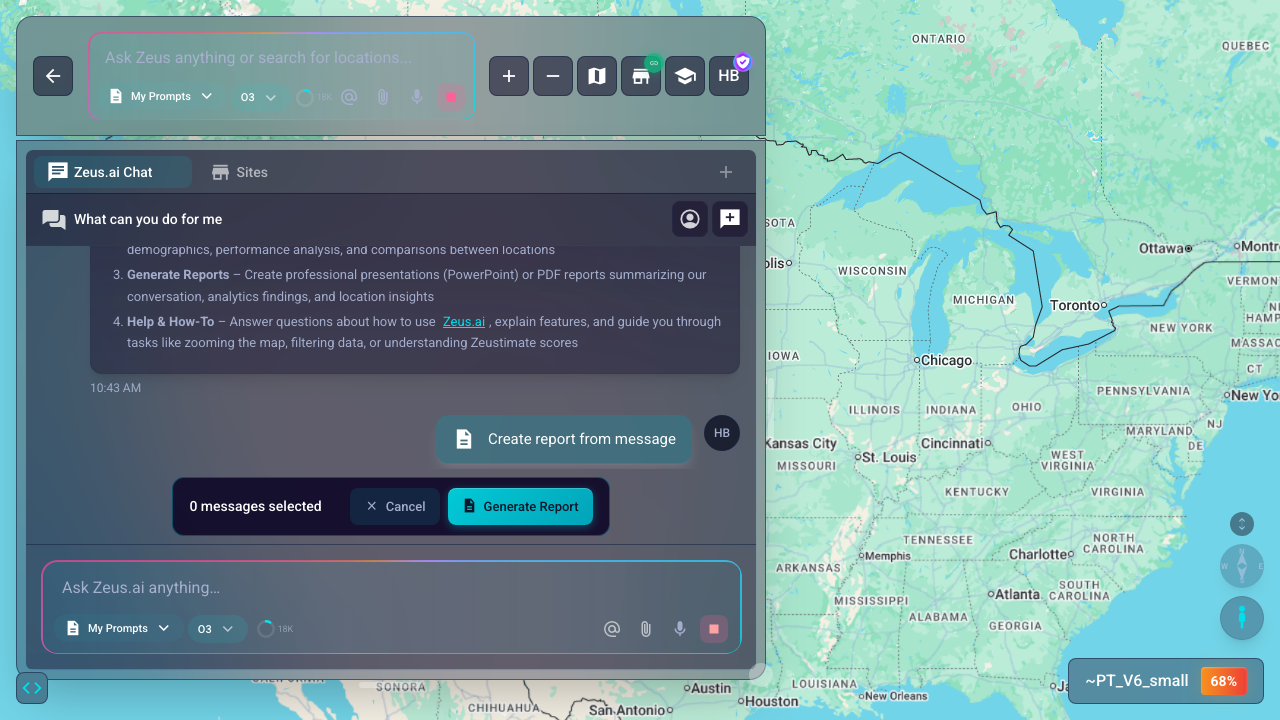
- After selecting messages, a Report Selection Bar appears at the bottom
- Shows count: "4 messages selected"
- Click Generate Report button
Step 3: Review and Customize
A preview screen appears with your report content:
Edit Content
- Prompt text area - Review and edit the generated report outline
- AI creates a structured outline from your selected messages
- Modify any section before generating
Basic Settings
Only one required field appears here before you generate:
| Setting | Options | Description |
|---|---|---|
| Title | Text input | Report title (e.g., "Zeus.ai Analysis Report") |
There is no format chooser at this step — every report generates as a shareable web link first. PDF and Deck are actions on the finished report card after generation (see Opening And Downloading Reports below).
Click Advanced Options to open the detail/tone/audience/language panel described next.
Advanced Options
The Advanced Options panel lays out four controls in a 2×2 grid:
Detail
Controls how much information the report includes:
| Detail level | Description |
|---|---|
| Brief | High-level summary |
| Medium | Balanced detail (default) |
| Detailed | Deeper analysis with supporting data |
| Extensive | Comprehensive coverage, longest report |
Tip: Start with Medium for most reports.
Tone
Choose the presentation style:
| Tone | Best For |
|---|---|
| Professional | Business meetings, formal presentations |
| Casual | Internal team reviews, informal updates |
| Educational | Training materials, explanatory content |
| Executive | C-suite presentations, strategic summaries |
| Inspiring | Persuasive/motivational framing |
| Custom | Free-text tone instruction you supply |
Audience
Tell the report who it's for so wording, examples, and technical depth adapt to the reader.
Language
Choose the report's output language from a 10-language dropdown.
Templates And Views
Reports can start from:
- Analytics already in the current chat thread.
- A report template from the Reports area.
- A workspace view or report builder flow that captures the relevant analytics cards.
Built-in starter views
Zeus.ai ships built-in starter views that appear in the Reports area's template picker. Every starter view (except the standalone Map template) opens with a pinned Map card, followed by a Street View card and an AI Summary section, then the analytics cards shown in the table below.
Site-scoped starter views (used when reporting on a specific location):
| Template | Cards included |
|---|---|
| Map | Map only (subject pin, sites, trade area) -- a full-page map for quick sharing or printing |
| Site Overview | Map, Street View, AI Summary, revenue metrics, demographics, traffic overview, smart comps |
| Comparative Site Analysis | Map, Street View, AI Summary, revenue metrics, smart comps, forecast drivers, scorecard |
| Demographics Snapshot | Map, Street View, AI Summary, demographics, scorecard, sites, traffic detail, closest road segments, mobile data, impact analytics |
| Executive Roll-up | Map, Street View, AI Summary, revenue metrics, demographics, scorecard, forecast drivers |
Shape-scoped starter views (used when reporting on a polygon or trade-area shape):
| Template | Cards included |
|---|---|
| Map | Map only (shape outline, contained sites, sites) -- a full-page map for quick sharing or printing |
| Trade-Area Drilldown | Map, Street View, AI Summary, demographics, traffic overview, traffic detail, smart comps |
| Shape Profile | Map, Street View, AI Summary, shape demographics, shape scorecard, shape attributes, nearby sites, analyst notes |
Using the Report Builder
The report builder (accessed from the Reports area in the app) lets you design a report visually using a canvas of analytics cards. The builder outline groups sections into three tiers:
Section Tier Groups
The report builder organizes sections into three tiers. The section pill bar at the top of the outline displays a divider between each tier so the three groups read as distinct regions:
- Street View is always locked to the very top of the pinned region. Its row shows an Anchored chip and has no drag handle, arrows, or remove button. Street View cannot be repositioned. When a report is run, the Street View card freezes the exact camera position (heading, pitch, zoom) and section height that were set at run time. Recipients who open a shared report see the same angle and proportions the author had when they clicked Run Report, and the panorama remains fully interactive. Every new report run re-captures the current camera state — it never reuses the camera position from a prior run on the same site.
- Map, AI Summary, and AI Metric Tiles sit in the Pinned region below Street View and display a Pinned chip in the outline. You can reorder them within the pinned region using the up/down arrows. The Map card renders a frozen static map image of the site; it is not interactive in the frozen report.
Body Sections
All other analytics cards (demographics, smart comps, scorecard evaluation, etc.) appear in the Body sections region below the pinned content. You can freely reorder body sections among themselves by dragging or using the up/down arrows.
Cross-Region Moves
Cross-region moves between the pinned and body regions are permitted for Pinned and Body sections. Drag a Pinned card (Map, AI Summary, AI Metrics) into the body region to demote it, or drag a body card into the pinned region to promote it. The card's config.layout.region setting persists the move.
Street View is Anchored and cannot leave the top of the pinned region regardless of drag target.
AI Sections Reuse Prior Results When You Rearrange
When you rearrange sections and re-run the report, AI-generated cards whose prompt and settings have not changed are reused from the previous run. Only cards with a changed prompt or configuration re-run. This avoids unnecessary AI processing when you are only adjusting layout.
Display Options Are Preserved in Frozen Reports
Display preferences you set via the gear icon on individual analysis cards in the builder are baked into the report at run time:
Map — basemap, 3D controls (Tilt/Rotate), marker visibility, Sites source selection, dataset selection (Sites of interest, Trade area), and pin popup configuration are baked at run time. When the Sites source is a saved Sites view, pin popup revenue and attribute settings are inherited from that view (the Zeustimate toggle is always baked from the report block). When the selected view is the one currently loaded in your workspace, the live working state -- including unsaved edits -- is captured at run time. The frozen map is fully interactive for recipients in the web viewer. PDF and deck exports receive a static raster image of the map. See Map Block for the full settings reference.
Mobile Data — panel visibility, map layer selection, layer opacity, and OGS retention-ring selection are reproduced for recipients who open the shared report.
Scorecards — the available-scorecards selection and the sections expand level are reproduced. Recipients can switch among the pre-baked scorecards without a new server request; for shape scorecards, alternate evaluations are pre-computed during the freeze step.
Custom sales metric — if your project has renamed its sales metric (for example "Gallons" or "Visits"), the custom label and format are stamped onto the report at freeze time. Recipients who open the share link see the correct label and formatted values in Scorecard Evaluation and Impact Analytics panels without needing access to the project settings.
Map block datasets -- the Datasets section of the map block's settings (gear icon on the map card) controls which data layers are baked into the frozen report map. Open Map Settings in the report builder and toggle each dataset on or off before running the report. Available datasets:
Dataset What it overlays in the frozen map Sites of interest The sites-of-interest layer pins Trade area The subject's trade-area boundary Nearby Traffic Nearby road segments colored by daily traffic volume (AADT) INRIX traffic wash Congestion-colored INRIX raster tiles baked near the subject (US only) Listings Real-estate listings near the subject; choose Current map or a saved listing search (requires the Listings bundle) Shapes Shape layers from the selected saved shape view, resolved near the subject Each dataset is off by default. The frozen map legend lists each enabled layer by name and color exactly as they appear on the workspace map at run time. The Shapes dataset bakes saved shape layers -- territories, trade-area polygons, or custom shapes -- into the static report map with the same fill color, stroke color, and layer name your workspace map shows.
Shapes source sub-picker: when the Shapes toggle is on, a Shapes source picker appears below it. There is no automatic default -- the report only bakes shapes when you explicitly select a saved shape view from the picker.
Saved shape view -- bakes that view's layers around the subject. The report fetches the view's layer geometry independently of the live map, so you do not need to load the view on the workspace map before running. When the selected view IS currently loaded on the workspace map, the report captures the live working state, including any unsaved style or visibility edits. Tile-only shape layers (external PMTiles sources) are excluded from independent baking.
If the project has no saved shape views yet, an empty-state note appears linking to the Shapes tab where you can create one.
When the Listings dataset is on, a Listings source picker appears below the toggle. Current map (the default) bakes the listings currently shown on the workspace map. Selecting a saved listing search bakes that search's results resolved near the subject, independent of what the live map is showing at run time. If the chosen search is the one currently loaded on the workspace Listings layer, any unsaved filter edits are included in the baked result. If no saved listing searches exist yet, an empty-state link in the picker leads to the Listings tab where you can create one.
Map Block
The Map card places an interactive, subject-framed map into your report. It is included by default in all built-in starter views and can be added to custom views from the card picker.
In the analytics tabs (live workspace)
When a template that contains a Map block is active, the Map section in the Location Analytics tab or Shape detail panel shows a compact placeholder: "The map appears in your report. To explore it live, use the workspace map." Below the placeholder you can expand the Map section to access the display settings inline -- the same settings available from the gear icon in the report builder.
Map display settings
Open the gear icon on the Map card in the report builder (or expand the Map section in the analytics tab) to configure:
| Setting group | Options |
|---|---|
| Basemap | Same basemap picker as the live workspace map: styled and performance themes, brightness/saturation/contrast adjustments, traffic, bicycle, POI categories, administrative boundaries, natural features |
| 3D Controls | Tilt -- let viewers pitch the map into a 3D perspective; Rotate -- let viewers change heading. Both are disabled for raster basemaps (satellite-only). |
| Markers | Show markers -- show the subject pin and nearby site pins on the map |
| Sites | All sites (default) -- the sites visible on your workspace map at run time. [Saved view name] -- only sites matching that saved Sites view, using its filter, overlay, and popup settings. When the selected view is the one currently loaded in your workspace, the report captures the live working state (including unsaved filter, overlay, and popup edits) without requiring a Save first. |
| Datasets | Sites of interest -- overlay the sites-of-interest dataset; Trade area -- overlay the trade-area ring |
| Pin popups | Show Zeustimate -- display each pin's Zeustimate in its popup (always configurable here). Show revenue and individual attribute columns are configurable here only when the Sites source is All sites. When the Sites source is a saved Sites view, revenue and attribute popup settings are inherited from that view; a note replaces those controls in the settings panel. To change popup revenue or attributes for view-sourced pins, edit those settings in the saved Sites view. |
Overlays such as traffic, transit, and bicycle paths are interactive-viewer-only and do not appear in PDF or deck exports.
In the report viewer (web)
The frozen map is fully interactive for anyone who opens the web report:
- An animated sonar pulse highlights the subject pin.
- Hover a site pin to preview its popup (revenue, Zeustimate, and the attributes you enabled).
- Hover a traffic segment to preview the road name and daily traffic count (AADT).
- Hover a Site Sonar point to preview the run name and Zeustimate.
- Hover a shape feature to preview the layer name.
- Click the pin button in a popup to pin it open; pinned popups stay visible after you move the mouse away. Drag a pinned popup to reposition it; resize it from the corner handle.
- Connector lines link each popup to its marker and update as you pan, zoom, or resize.
- A collapsible Legend panel sits in the map corner. Click the legend header to expand or collapse it. Use the eye icon on any legend row to temporarily show or hide that layer in the viewer (viewer-only preference -- does not change the saved report).
- Pan, zoom, tilt, and rotate work as in the live workspace map (subject to the 3D Controls settings configured at build time).
In PDF and deck exports
The map is rendered as a static image that matches the camera position and basemap from the report run. Location pins appear as colored icons. Site-type visual overlays (halos, tags, and text labels) configured for each site type are rendered on the static image alongside the pins; bar graphs are not included. Popups that were pinned (open) at capture time are reproduced at their frozen positions on the static image.
Per-User View Overlay Persistence
Your in-viewer arrangement -- open pin positions, camera, and other view state -- is saved automatically per report run per user. The next time you open the same report, your arrangement is restored.
Author arrangement as the share default. When the report author has saved an arrangement, that arrangement becomes the starting view that public share recipients see when they open the link. Recipients can interact with the map freely, but their changes are not saved back (anonymous viewers cannot persist an overlay).
Authenticated share viewers (users who open a share link while signed in) can persist their own overlay on top of the author's.
Running a Report View
You can run a saved report view as a report from two places:
- The analytics split control -- In the Location Analytics tab or a Shape Analytics panel, a split control in the header lets you select and immediately run any saved view against the current site or shape.
- The Views menu or report builder toolbar -- Click the play button (run control) next to the active view.
The Split Control
[ Deep Dive v | Report ]- Left side (view selector chip) -- Shows the name of the active view (for example, "Deep Dive"). Click it to open a list of available starter and custom views for the current site or shape type. Selecting a row makes that view active.
- Right side (Report button) -- Runs the active view immediately. The button shows a spinner and reads Running while a run is in progress, and is disabled until the run finishes. When the button is unavailable, it explains why instead of doing nothing: hover it on desktop, or tap it on a touch device, to see the reason -- for example a report already running, views still loading, the view still saving, or the workspace busy. The reason is also reachable by keyboard focus.
Running a View
- Open a location or shape in the workspace to load its analytics.
- Find the split control in the analytics panel header (or open the Views menu / report builder toolbar).
- Confirm the active view name on the chip. Click the chip to switch views if needed.
- Click Report. A toast notification appears in the lower corner of the screen. You can close the Views menu or switch tabs while the report runs.
Run Progress
The toast progresses through stages as the report runs:
| Stage | Toast description |
|---|---|
| Starting | "Resolving data..." |
| Processing | "Rendering report..." |
| Near completion | "Finishing up... May take up to 15 seconds" |
| Waiting on live data | "Waiting for live data... (Demographics, Traffic)" |
If live data sources such as demographics or traffic are not yet ready, the toast shows the waiting message until they resolve or the run completes without them.
After the Run Completes
When the report finishes, the toast updates to "Report ready from '[view name]'":
- Subtitle -- The subject name (for example, "for Lehi UT") with the site icon.
- Open report -- Opens the completed report in the viewer in a new tab, then the toast auto-dismisses after a short delay.
- Copy link -- Copies a shareable URL to your clipboard. A brief "Link copied to clipboard" confirmation appears, then the toast auto-dismisses. If your browser blocks clipboard access, a separate toast displays the full link for manual copying and the success toast stays visible.
If any sections were omitted because live data was unavailable, the toast description lists the skipped sections.
Concurrent and Sequential Runs
Each run gets its own persistent toast. Running a second view while the first is still in progress produces two separate toasts so you can track and open both results independently.
Running the same view against the same site simultaneously is blocked: the Report button stays disabled (spinner shown) until the in-progress run finishes.
If the Run Fails
The toast shows "Report failed from '[view name]'" with a brief error description and stays visible until you close it. Click Report again to retry once the underlying issue is resolved.
Agent-Initiated Reports
The AI assistant can create reports when you explicitly ask for one:
- "Create a report from this."
- "Export the last analysis as PDF."
- "Make a deck from our discussion."
- "Create a PowerPoint from this."
Compound requests work in one turn. When your message asks for analysis AND a report output together -- for example, "Get the demographics for this site, then create a PowerPoint" -- the assistant runs the analytics, then immediately calls generateReport without asking for confirmation again. Your original request is treated as permission; no second prompt is needed.
If you ask for a report about a site and no analytics have been run yet (and you did not request specific analytics in the same message), the assistant gathers the relevant analytics first, then generates the report. If the required inputs are genuinely unavailable, the assistant will explain what is missing rather than asking whether to proceed.
After Generation
Opening And Downloading Reports
When the agent finishes generating a report, the report card in chat shows the site icon next to the report title, and the status reads "The report is ready. Open or copy the link to view it." Clicking Copy link copies the share URL and briefly shows a "Report link copied" confirmation.
The card can include:
- Open — opens the shareable web report in the viewer.
- Copy link — copies the share URL to your clipboard.
- PDF — downloads the PDF artifact when available.
- Deck — downloads the deck artifact when available.
The same report run can produce a link, PDF, and deck output bundle. Use the web link for quick sharing, PDF for fixed-format distribution, and deck for presentation workflows.
Exporting from the Report Viewer
When you open a report in the viewer, an Export button appears in the toolbar at the top of the page. Clicking it opens a dropdown menu with the following options:
| Option | Description |
|---|---|
| Copy web link | Mints a token-protected public URL for the current report run and copies it to your clipboard. The item briefly shows Web link copied to confirm. |
| Download PDF | Downloads a rendered PDF of the report. A toast notification tracks generation progress and lets you open the file when it is ready. |
The share URL is publicly accessible to anyone who has it. Only share it with intended recipients.
If your browser blocks clipboard access (for example, in certain embedded or insecure contexts), a toast notification displays the full link so you can copy it manually.
Print Preview Mode
The Report Settings gear menu includes a View mode control with two options:
- Web (default) — the normal responsive layout you work with interactively.
- Print — a Letter-width preview that matches the exact page layout, pagination, and light-on-white theme that the exported PDF uses. Columns and section-height settings are fixed in this mode and their controls are hidden.
Switching to Print mode embeds a live PDF preview in the viewer so you can see exactly what recipients will download before you export. The theme toggle is hidden in print mode; the viewer forces a light theme to match the PDF output. Switch back to Web to resume interactive editing.
Report History
Saved report runs are available from the Reports tab in the workspace (sidebar > Locate > Reports) and via the assistant.
Re-running a Report from the History Table
Each row in the history table has an action menu (three-dot icon, visible on hover). Selecting Re-run from that menu:
- Shows a loading toast immediately: "Re-running '[report name]'..."
- The app polls the server every 1-2 seconds until the document is ready.
- On success, a persistent toast appears with Copy link and Open report buttons.
- If generation fails, an error toast explains the reason.
The report does not auto-open in a new tab. Click Open report in the toast when you are ready to view the result.
Via the Assistant
You can ask the assistant to:
- "Show my recent reports."
- "Share the last report for this site."
- "Give me the PDF for the Lehi report."
- "Archive this old report."
- "Restore that archived report."
For prior reports, the assistant should find the saved run first and share or archive that run. It should not generate a duplicate report unless you ask for a new version.
Canceling Generation
If you change your mind:
- Click the Cancel button during generation
- Report generation stops immediately
- No file is created
Tips for Better Reports
Select Relevant Messages
✅ Do:
- Include questions and answers that tell a story
- Select messages with data, insights, and conclusions
- Choose 3-10 messages for best results
❌ Don't:
- Include "hello" or "thanks" messages
- Select too many messages (report becomes unfocused)
- Include unrelated topics
Edit the Prompt
Before generating:
- Review the AI-generated outline
- Add clarifications or additional context
- Remove irrelevant sections
- Reorganize if needed
Choose the Right Format
| Scenario | Recommended Format |
|---|---|
| Email to stakeholders | |
| Team presentation | Deck |
| Quick share via link | Link |
| Print for meeting | |
| Reusable presentation | Deck |
Adjust Detail Level
| Audience | Detail Level |
|---|---|
| Executives | Brief or Medium |
| Team members | Medium or Detailed |
| Technical deep-dive | Detailed or Extensive |
| Quick update | Brief |
Troubleshooting
"Generate Report" Button Disabled
Cause: No messages selected Solution: Select at least one message with content
Report Generation Failed
Possible causes:
- Internet connection interrupted
- Report service temporarily unavailable
- Selected content too short or empty
Solutions:
- Check your internet connection
- Try again in a few moments
- Select different messages with more content
- Refresh the page and retry
Report Cannot Run -- AI Section Has No Prompt
If the preflight check blocks the run with a message like:
"Report cannot run: AI Summary has no prompt selected. Edit this view and configure a prompt for each AI section, or use a different view."
The selected view contains an AI section (AI Summary or AI Metric Tiles) with no prompt assigned. The section cannot generate content until a prompt is configured. See AI Summary and Metrics Sections -- Troubleshooting for steps to assign a prompt or switch to a view that already has prompts configured (such as the built-in Deep Dive view template).
A Section in the Report Shows "No Scorecard Configured" or "Section Unavailable"
Individual report sections can fail to populate without failing the entire report. When a card cannot resolve its data, the report shows an inline notice instead:
| Notice | Cause | Action |
|---|---|---|
| No scorecard configured | The project has no scorecards set up | Open the Scorecards tab (sidebar -> Locate -> Scorecards) and create at least one scorecard, then re-run the report |
| Live data unavailable | The underlying data could not be fetched at run time | Re-run the report; if the notice persists, check your internet connection |
| Section unavailable | The data source returned nothing for this subject | Check that the relevant data (scorecards, smart comps, etc.) is configured for this project, then re-run |
Other sections in the same report render normally even when one section shows this notice.
Report Content Not as Expected
Solutions:
- Edit the prompt before generating
- Select different messages that better represent your needs
- Regenerate with adjusted settings
- Try a different detail level (more or less information)
"Failed to create shareable link" Error in the Export Menu
Cause: The server could not mint a share token for the current report run (the run may still be loading, or a transient server error occurred). The error appears inside the Export dropdown menu.
Solutions:
- Wait for the report to finish loading, then open the Export menu and try Copy web link again.
- Check your internet connection.
- Reload the page and reopen the report, then try again.
Report Link Not Working
Check:
- Link copied correctly (no extra spaces)
- Internet connection active
- Link not expired or archived
Report Generation Limits
Technical Limits
- Length: short, medium, or long
- Message selection: Recommend 3-10 messages
- Generation time: 30-60 seconds average
- File size: Varies by content (typically 1-5 MB)
Best Practices
- One topic per report - Don't mix unrelated conversations
- Quality over quantity - Select meaningful messages
- Review before generating - Edit the prompt for clarity
Privacy and Sharing
Report Content
- Reports contain ONLY the messages you select
- No other conversation data is included
- You control what goes into each report
Shareable Reports
- Shareable links - Treat them as shareable web content
- Access behavior may depend on the generated output and hosting flow
- Be cautious - Only share with intended recipients
Downloaded Outputs
- Your files - Stored on your device
- Full control - Edit, share, or delete as needed
- No tracking - We don't monitor downloaded files
What the AI can do for you with this
The agent's report-family capabilities cover both fresh generation and reuse of saved runs and views. Capability names from the catalog:
- Reports, Views, History & Help Docs (
generateReport) — generate a new report from the current chat analytics or a workspace view. - List Report Views (
listReportViews) — show saved report views compatible with a given site or project. - Run Report View (
runReportView) — run a saved view (or build a custom one-off view on the fly) against a specific site, without generating from the conversation. - Create Report View (
createReportView) — save a named, reusable report view for later use. Ask the agent "Save a view called X with Zeustimate Forecast, Demographics, and Scorecard Evaluation" and the view is persisted without running it. Chain withrunReportViewin the same turn if you also want to see the report immediately. - List Recent Reports (
listRecentReports) — surface the project's most recent report history so you can share or revisit prior runs. - Share Report (
shareReport) — produce a shareable link or PDF for a past report run. - Archive Report (
archiveReport) — archive or restore a saved report.
Worked example
"List my recent reports and share the last one as a PDF."
The agent calls listRecentReports to enumerate the project's report history, then calls shareReport on the most recent run with a PDF artifact request. The agent does not re-generate a duplicate report in this case — sharing an existing run is preferred over regeneration, which is enforced by probe-scenarios/reporting.mjs.
A complementary example:
"For [site name], look at the saved report views compatible with this site and run the most recently updated one."
This triggers listReportViews then runReportView — also exercised by probe-scenarios/reporting.mjs.
Map Reports vs. Analytics Reports
The reports on this page are built from chat analytics or from a site/shape analytics view. If you instead want to freeze the whole live map view -- your sites, shapes, Site Sonar results, listings, and traffic exactly as drawn -- into an interactive, shareable snapshot, use a Map Report created from the map toolbar's Create map report button. See Map Reports.