
Appearance
Understanding Workspace Tabs
Quick Answer
Workspace tabs let you switch between Sites, Location, Chat, Layers, Base Map, Prompts, and other optional tools. On desktop, tabs usually appear in a workspace panel next to the map. On mobile, they appear in the expanded bottom-sheet view.
Sidebar vs tabs: The dark left sidebar (Locate / Customer Insights / Build / Sell) switches between SiteZeus products. Workspace tabs live inside the panel beside the map and switch between views within the current product. Some surfaces — like Mobile Data — appear as a section inside another tab (Location Analytics) rather than as a standalone tab.
Where to Find Tabs
Location
- Open a workspace panel by clicking a marker, the
Sitesbutton, theLayersbutton, or theBase Mapbutton - Look at the top of the panel for the tab strip
- On desktop, the panel is usually beside the map
- On mobile, the tab strip appears at the top of the expanded bottom sheet
- Click any tab to switch to it
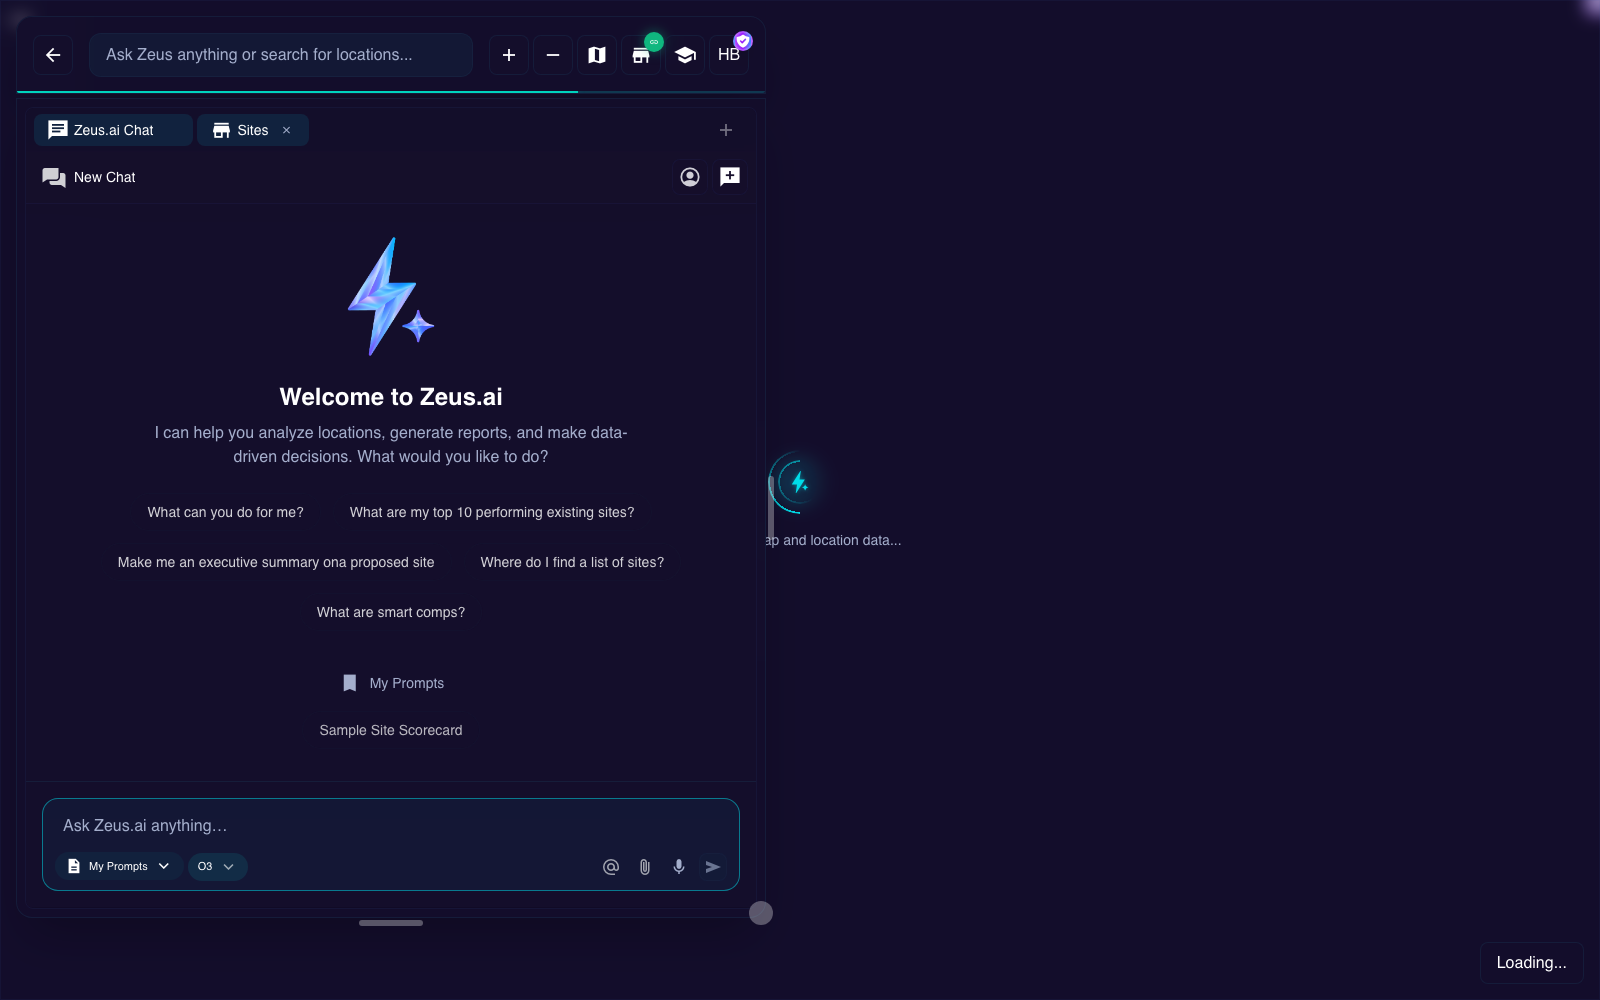
Desktop workspace tab strip:
┌─────────────────────────────────────────────────────┐
│ [Sites] [Location] [Chat] [Layers] [Base Map] [≡ 5] │
├─────────────────────────────────────────────────────┤
│                                                     │
│              Tab content appears here               │
│                                                     │
└─────────────────────────────────────────────────────┘
The ≡ icon at the right edge is the Tabs Menu button. It shows a count badge for the number of open tabs in the cell. Click it to add new tabs, switch between open ones, or close them.
Tab Categories
Tabs are organized into five categories in the Tabs Menu:
| Category | Tabs included |
|---|---|
| Sites | Sites, Location (Location Analytics drill-in) |
| Shapes | Shapes, Shape Analytics drill-in |
| Traffic | Traffic |
| Map | Layers, Base Map, Site Sonar, Listings |
| Project | Chat, Scorecards, Revenue Grades, Reports, Prompts, Forecasting Model |
Available Tabs
🏪 Sites Tab
Icon: store Purpose: Browse and filter all locations in your project
What you'll see:
- Save view button (header): Snapshot the current filters and site-type overlays under a name for later reuse or company sharing. Enabled once a filter is active or an overlay is configured. Hidden while a saved view is loaded (use the loaded-row controls instead).
- Saved Views card: Lists named filter+overlay snapshots for the current project. Load a view by clicking its eye icon; the loaded row shows dirty-state controls (Save changes / Save as new) when filters drift from the saved state. See Saved Views.
- Filtering Map toggle: Connect/disconnect filters from map display
- Search box: Multi-term search for locations
- Filters | Overlays switcher (desktop): Switch between the filter controls panel and the site-type visual overlay editor. On mobile, Filters and Overlays appear as separate pills in the tab row alongside the locations list.
- Filter controls (Filters panel): Revenues (existing sites), Sites of Interest Metrics (per SOI layer), site type, categories, attributes
- Overlays panel: Customize how each site type renders on the map — bar graphs, halos, tags, and text labels — for Existing, Proposed, Layer, and Search sites. Category rows let you override a parent type's settings. See Visual Overlays for Map Markers.
- Location list: All locations matching current filters
- Sort options: Order by name, revenue, date, etc.
- Rename control (pencil icon on a row): Rename an existing or proposed site directly from the list. Renaming a saved company site persists for everyone on your team; renaming a dropped search pin only changes it on your own device. Renaming requires edit permission for that site type, and layer sites cannot be renamed.
- Export button (download icon): Downloads the filtered list as a CSV file (ID, Name, Address, City, State, Postal, Type, Revenue)
When to use:
- Finding locations that match certain criteria
- Getting an overview of all sites
- Filtering what appears on the map
- Selecting a location to view analytics
How to open:
- Click the store icon (🏪) in the chat bar, OR
- Click the Sites tab in the secondary workspace
📊 Location Analytics Tab
Tab bar label: Location Icon: analytics Purpose: View detailed analytics for a specific location
The tab appears as Location in the tab strip and Tabs Menu. The full name "Location Analytics" is used throughout help documentation and in the panel header.
What you'll see:
- Location header: Name, address, type
- Zeustimate/Revenue Metrics: Revenue prediction with grade, confidence, AUV comparison
- Demographics: Population, income, age data for the area
- Forecast Drivers: Factors driving the prediction
- Smart Comparables: Similar locations for comparison
- Location Attributes: Custom attributes for the site
- Chat button: Opens an inline chat panel scoped to the current site (see below)
Site chat panel:
A "Discuss this site with Zeus.ai" button appears in the Location Analytics header for Proposed, Existing, Search pin, and Layer pin site types. Clicking it opens an inline chat panel where you can ask questions about the site without leaving Location Analytics. On first open a suggested analysis prompt is pre-filled in the composer — send it as-is, edit it, or click "Clear & type my own" to start fresh. A new chat icon in the panel header starts a new thread on the same site. See Location Analytics Chat for details.
When to use:
- After clicking a location marker on the map
- When you need detailed insights about a specific site
- Comparing locations (open multiple analytics tabs)
- Understanding why a site performs as it does
How to open:
- Click any location marker on the map -
Location Analyticsopens automatically - Or select a location from the Sites list
💬 Chat Tab
Icon: chat Purpose: Expanded view of your AI conversation
What you'll see:
- Full conversation history
- Larger text area for reading
- Same chat input as the chat bar
- Thread management options
When to use:
- Long conversations where you need more reading space
- Reviewing past messages
- When you want the chat to fill more screen space
- Managing multiple conversation threads
How to open:
- Click the Chat tab in the workspace
- Or expand the chat by clicking in the chat bar
📚 Layers Tab
Icon: layers Purpose: Control what's shown on top of the map — clustering, site filters, and visual overlays
What you'll see:
- Smart Clustering: Toggle and configure marker clustering
- Site Layer Filters: Control visibility of existing, proposed, layer, and search sites
- Visual Overlay Options: Click a site type row to customize halos, tags, text labels, and bar graphs for that type. The same overlay controls are also accessible from the Sites tab > Overlays pane; both surfaces write to the same settings.
When to use:
- Showing/hiding specific site types
- Optimizing performance with clustering
- Customizing halos, labels, and bar-graph overlays for a site type
How to open:
- Click the layers icon (📚) in the chat bar, OR
- Click the Layers tab in the secondary workspace
🗺️ Base Map Tab
Icon: map Purpose: Customize the underlying map — theme, labels, data layers, and cartography
What you'll see:
- Map Themes: Choose visual style (Vector/Raster themes)
- Data Layers: Real-time Traffic, Transit, Bicycle overlays
- Map Features: POI categories, map elements (roads, water, labels)
- Quick Adjustments: Brightness, saturation, contrast (raster themes only)
Important:
- The old standalone
3D Modetoggle was removed - Supported vector and satellite-compatible themes now control 3D behavior automatically
When to use:
- Changing the map theme or brightness
- Toggling data-layer overlays like Real-time Traffic
- Choosing a theme that supports 3D visualization
How to open:
- Click the map icon (🗺️) in the chat bar, OR
- Click the Base Map tab in the secondary workspace
📡 Site Sonar Tab
Icon: radar Purpose: Run market planning and whitespace discovery workflows
What you'll see:
- Forecast filter to narrow the revenue band
- Minimum distance filter to reduce nearby duplicates
- Scorecard toggle and selector for scored results
- POI selection tree with expandable categories and brand search
- Progress panel while Site Sonar is running
- Results table with export options
- Saved Layers section for reloading previously saved Site Sonar result sets
Current behavior:
- Site Sonar runs real analysis and can optionally apply a scorecard after the run completes
How to open:
- Click the Tabs Menu (
≡) and select Site Sonar under the Map category
🚦 Traffic Tab
Icon: directions_car Purpose: Review road-segment traffic detail for the selected map segment
What you'll see:
- Road name and direction/bearing
- Cars / day headline metric
- Peak period, peak hour, and busiest day
- Typical Hourly Volume chart with Grid, Bubbles, and Summary views (mobile defaults to Summary)
When to use:
- After turning on Real-time Traffic in the Base Map tab
- When you want road-level traffic detail around a site
- To compare access patterns before making a location decision
How to open:
- Turn on Real-time Traffic in the Base Map tab
- Select a traffic segment on the map
🧩 Shapes Tab
Icon: shape_line Purpose: Manage Trade Areas and Territories — drive-time, ring, and custom polygons — and run shape-level analytics
What you'll see:
- Search-to-pill input for finding existing shapes by name or attribution
- Trade Areas split into a Standard section (system-synthesized rings and drive times) and a Custom section (your own or shared trade-area sets, read-only here)
- Territories section for custom territory sets
- Saved Views card for restoring named shape selections
- Design controls for color, fill, and label styling
- Demographics and Attributes summaries when a shape is selected
- PNG export for the active shape view
- Import button (on the trade-area and territory sections): bring shapes in from a file — see Importing shapes below
- ZIP Code Report: select one or more shapes in a set to reveal a bulk-action bar with a ZIP Report action — see ZIP Code Report below
When to use:
- Comparing demographics across drive-time or polygon trade areas
- Drawing trade-area rings around the sites you care about
- Drawing or importing custom territories for portfolio analysis
- Reviewing Synergos metadata for system shapes
Standard Trade Areas: The Standard section lets you draw synthesized trade areas around your sites without a saved shape set:
- Concentric rings (Miles) — pick one or more ring distances (0.25 to 10 miles). Rings draw around every in-scope site. A List / Picker toggle switches between full-width list rows (circle icons that grow with the radius) and a compact chip picker. New projects open in Picker by default; your last-used mode is remembered per project.
- Drive times (Minutes) — turn on the project's generated drive-time sets (for example, 5- or 10-minute). A drive-time option is disabled when the project has not generated that set. Rows use a friendly "N minute drive time" label.
Site scope and site-type filter: Both the Standard and Custom trade-area sections honor two scope controls so shapes draw only around the sites you want:
- All sites / Selected toggle — Selected limits trade areas to sites that currently have an open Location Analytics tab; All sites uses every in-scope site.
- Site-type dropdown — a grouped Existing/Proposed multi-select (with category icons and counts) that filters which site types trade areas render around. It defaults to Mature, New, Consideration, Letter of Intent, Approved, and In Development.
When only some of a set's shapes are in view, the row shows a "Showing X/Y features" count.
Trade areas follow map visibility: Standard rings and drive-time or custom trade-area sets draw only around sites that are currently visible on the map. Hiding a site type (or a site) with the map visibility toggles or site-type filters drops both that site's ring and its set shapes together, so the two stay in lockstep. (Panning or zooming does not blank shapes — only filtering does.)
Saved Views remember your selection: Saving a Shapes view captures the Standard Trade Areas selection — the active ring distances, the All sites / Selected scope, and the site-type filter — alongside the polygon and territory layers. Loading the view restores that selection, and changing any of it marks the view as having unsaved changes.
How to open:
- Click the Tabs Menu (
≡) and select Shapes under the Shapes category
For deeper shape inspection (variable impact, comps, scorecards for a polygon), use the companion Shape Analytics tab that opens when you select a shape.
Canada projects: Standard shape sets for Canada (Provinces, Postal Codes) are listed with a Coming Soon indicator. US standard sets (Counties, ZIP Codes, etc.) are not shown for Canadian projects. Custom trade areas and territories work the same regardless of country.
Importing shapes: Use the Import button on the Custom Trade Areas or Territories section — or drag a file onto the tab — to bring shapes in from a GeoJSON, shapefile, KML, or CSV file. Import opens a centered dialog that walks through three steps: choose the file and a destination set (a new set, or add to / replace an existing one), map the columns, then review each row before importing. Progress appears on the destination set's own row.
ZIP Code Report: Select one or more shapes in a set (works for standard sets such as ZIP codes, counties, and DMAs, as well as your own custom shapes) to open the bulk-action bar, then click ZIP Report to export a CSV of the ZIP codes each selected shape covers. A single report covers up to 50 shapes; if you select more, reduce the selection before running it.
🏗️ Listings Tab
Icon: home_work Purpose: Browse REsimplifi real estate listings on the map alongside your sites
Limited Trial: A Limited Trial badge appears next to "Listings" in both the tab header and the Tabs Menu dropdown row. This indicates Listings access is provided on a trial basis as part of the Listings bundle. Contact your SiteZeus account team to discuss continued access.
What you'll see:
- Transaction Mode toggle (For Sale / For Lease)
- Filter sections for price, square footage, property type, and attributes
- Saved Views card to reload named filter combinations
- Listing grid with sortable columns and hover cards
- Street View preview from the listing card
When to use:
- Sourcing candidate sites near existing or proposed locations
- Comparing real estate availability across markets
- Saving a filter set for repeated use during site selection
How to open:
- Click the Tabs Menu (
≡) and select Listings under the Map category (available where your subscription includes the Listings bundle)
💡 Prompts Tab
Icon: lightbulb Purpose: Create, edit, delete, and organize saved prompts for chat and report AI sections
What you'll see:
- Library list (left panel) — all saved prompts with name, description, visibility badge, Starter badge (for system-provided prompts), and a usage count badge showing how many report views or AI sections reference each prompt
- Editor panel (right panel) — form to create or edit a prompt, plus a Used by list showing which report templates and section types reference it
- New Prompt button in the tab header to start a blank prompt
- On mobile: a Library / Editor toggle to switch between the two panels
When to use:
- Building a personal library of reusable chat prompts
- Reviewing which prompts are actively used in reports before editing or deleting them
- Customizing a Starter prompt into your own editable version
How to open:
- Click Prompts (lightbulb icon) in the left sidebar, OR
- Click the Tabs Menu (
≡) and select Prompts under the Project category, OR - Click My Prompts in the chat composer, then click Manage
Forecasting Model Tab
Icon: crystal_ball Purpose: The Predictive Power Center — model accuracy analytics and settings for the project's accepted Zeustimate model
What you'll see:
A segmented toggle at the top of the header switches between two sub-tabs, both Enterprise tier only (lower-tier accounts see a preview illustration on either sub-tab rather than live data):
- Settings — fully functional model configuration and rebuild controls: trade areas, variables, outlier accuracy, the Impact model, data bundles, cross-validation folds, and advanced parameters, plus a floating Rebuild bar. See Forecasting Model: Settings.
- Analytics — project-scoped dashboard with model accuracy sections, AI Summary and AI Metrics sections, and an inline mini-chat.
The Analytics dashboard includes sections for Model Health, Actual vs Zeustimate, Binning / What-If, Global Variable Importance, Predictive Power Map, and Attribute x Region heatmap. Sections can be reordered, added, removed, or configured with Display Options using the same controls as Location Analytics.
Additional controls (Analytics sub-tab, Enterprise only):
- Report button: Run a project-scoped report from the dashboard.
- History button (clock icon): View past reports for this project's model inline.
- Chat button: Toggle an inline mini-chat panel to discuss the model with Zeus.ai.
- Fullscreen button: Expand the tab to overlay the map and chat area.
When to use:
- Reviewing how accurately the accepted Zeustimate model performs across the portfolio
- Identifying geographic regions or attribute segments where the model is strongest or weakest
- Exploring portfolio-level What-If scenarios by adjusting forecast bins
- Generating or reviewing model reports for stakeholders
How to open:
- Click Forecasting Model in the left sidebar under the Locate group, OR
- Click the Tabs Menu (
≡) and select Forecasting Model under the Project category
See Forecasting Model: Analytics for detailed documentation.
Surfaces You'll Hear About But That Aren't Workspace Tabs
A few features are referenced like tabs but live elsewhere:
| Surface | Where It Actually Lives |
|---|---|
| Mobile Data | A section inside the Location Analytics tab. It bundles UberMedia foot-traffic products (OGS, P2P, CEL, CDL) for the selected site. See Location Analytics. |
| Customer Insights | A standalone product reached from the left sidebar (the Customer Insights icon), not a workspace tab. See Customer Insights. |
| Project Settings | Retired as a workspace tab. Appearance, layout, and reset-workspace controls now live in the profile menu (top right or sidebar footer). Scorecards open from the chat or directly from the Scorecards tab. |
| Heat Map | Retired as a workspace tab. Heat Map is now only a map-layer visibility toggle in the Layers tab (rendering is still coming soon). See Map Data Layers. |
Navigating Between Tabs
Switching Tabs
- Find the tab bar at the top of the secondary workspace
- Click the tab name or icon you want to switch to
- The content updates immediately
Visual Indicators
- Active tab: Highlighted background or underline
- Inactive tabs: Normal/dimmed appearance
- Tab with activity: May show a badge or indicator
Adding a New Tab
- Click the Tabs Menu button (
≡/view_listicon) at the right end of the tab bar. On desktop this opens a dropdown; on mobile it opens as a bottom sheet. - Browse by category (Sites, Shapes, Traffic, Map, Project). Tabs you have not yet opened appear in a muted style.
- Click a not-yet-open row (or the
+icon on hover) to open that tab type. - The new tab opens and becomes active.
Empty-state shortcut: If the workspace has no tabs open, an empty state appears with a message and an inline tab picker listing the same tab types (grouped by category) that the Tabs Menu shows. Click any row in the picker to open that tab directly without opening the Tabs Menu. If all tab types are already open, a fallback message appears instead.
Closing a Tab
- Hover over the tab in the tab bar and click the
Xto close it directly. - Or open the Tabs Menu, find the open tab row, and click the
xicon that appears on hover. - Note: Some tabs may not be closeable (for example, single-instance tabs that are the only tab in a cell).
Quick Access from Chat Bar
| Chat Bar Button | Opens Tab |
|---|---|
| 🏪 Store icon | Sites tab |
| 📚 Layers icon | Layers tab |
| 🗺️ Map icon | Base Map tab |
| Click marker | Location Analytics tab |
Tab Combinations for Common Tasks
| What You're Doing | Recommended Setup |
|---|---|
| Finding specific locations | Sites tab open, map visible |
| Analyzing a single site | Location Analytics tab |
| Comparing multiple sites | Multiple Analytics tabs |
| Getting AI help | Chat tab or chat bar |
| Customizing map appearance/themes | Base Map tab |
| Customizing site-type overlays | Sites tab > Overlays pane, or Layers tab |
| Running whitespace search | Site Sonar tab + map |
| Reviewing road activity | Traffic tab + traffic layer |
| Working with trade areas | Shapes tab + Shape Analytics tab |
| Sourcing real estate | Listings tab + map |
| Managing reusable prompt templates | Prompts tab |
| Reviewing Zeustimate model accuracy | Forecasting Model tab (Analytics sub-tab, Enterprise) |
| Reviewing foot-traffic for a site | Location Analytics tab → Mobile Data section |
| Quick filtering | Sites tab |
Tips
Quick Tab Access
- Click location marker → Opens
Location Analyticsautomatically - Click 🏪 in chat bar → Opens Sites tab
- Click 📚 in chat bar → Opens Layers tab
- Click 🗺️ in chat bar → Opens Base Map tab
Working with Multiple Views
- Keep Sites tab open while exploring to quickly filter
- Use Location Analytics after selecting a location
- Switch to Chat for AI assistance anytime
Mobile Tab Navigation
On mobile devices:
- Tabs appear at the top of the expanded bottom-sheet panel
- Tap tab buttons to switch
- Tap the Tabs Menu button (
≡icon) to add, switch, or close tabs via a bottom sheet
Troubleshooting
Can't Find a Tab?
- Make sure a workspace panel is open (click 🏪, 🗺️, or a marker)
- Click the Tabs Menu button (
≡icon at the right of the tab bar) to see all available tab types grouped by category; not-yet-open types appear in a muted style and can be added from there - Some tabs only appear in certain contexts (for example, Traffic opens when you select a traffic segment on the map)
Tab Content Not Loading?
- Check your internet connection
- Try clicking the tab again
- Refresh the page if the issue persists
Tab Seems Stuck?
- Click a different tab, then return
- Check if a loading spinner is showing
- Try collapsing and reopening the panel
Too Many Tabs Open?
- Close unused tabs with the X button
- The workspace remembers your configuration