
Appearance
Smart Comps Explained
See also (agent workflow):
analytics-composition.mdfor how the assistant fans out Smart Comparables alongside revenue, demographics, and variable impact.
Quick Answer
Smart Comps (Smart Comparables) finds existing locations most similar to your selected site based on demographic and business attributes, helping you understand performance benchmarks from real-world comparable stores.
What Are Smart Comps?
Smart Comps identify:
- Similar existing locations to your selected site
- Performance benchmarks from real stores
- Similarity scores showing match quality
- Revenue grades for quick comparison
- Filterable attributes to refine matches
Where to Find Smart Comps
- Select a location on the map (click a marker)
- Open Location Analytics (opens automatically when you select)
- Scroll to the
Smart Comparablessection - View the subject site and comparable locations
Understanding the Smart Comps Display
Subject Site Card
At the top, you'll see your selected location:
- Site icon and name
- Address (secondary label)
- Revenue badge with grade (A, B, C, D, F) and formatted value
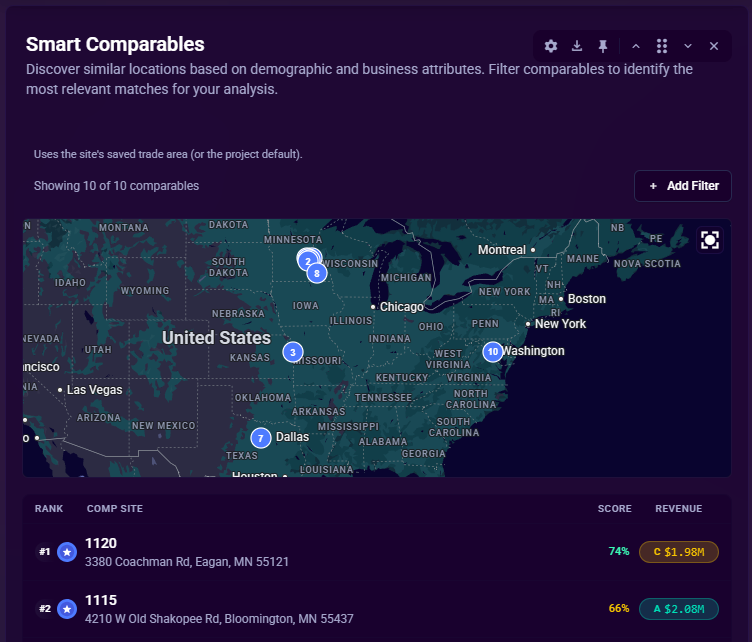
Section Mini-Map
The Smart Comps section includes an embedded mini-map that is on by default. The map shows:
- The subject site pin at its location
- Comparable locations plotted geographically, so you can see how the comps cluster around your site
To configure the mini-map, open the gear icon (Display Options) in the section header:
- Show map — toggle the mini-map on or off.
- Base map — choose a basemap theme (Vector or Raster options).
Settings persist per session and carry over to frozen reports.
Comparables Grid
Below the subject site, comparable locations are displayed:
| Element | What It Shows |
|---|---|
| Rank badge | #1, #2, #3... based on similarity score |
| Location name | Name of the comparable site |
| Address | City, State, ZIP |
| Similarity badge | Percentage match (e.g., "87% match") |
| Similarity bar | Visual indicator of match quality |
| Revenue badge | Grade and revenue amount |
| Distance | Distance from subject site (in miles or feet) |
Similarity Score Colors
| Score Range | Color | Quality |
|---|---|---|
| 90-100% | Electric Cyan | Excellent match |
| 80-89% | Cyan | Very good match |
| 70-79% | Teal | Good match |
| 60-69% | Blue-green | Decent match |
| 50-59% | Salmon | Average match |
| Below 50% | Coral red | Weak match |
Filtering Comparables
Adding Filters
- Click "Add Filter" button (top right of section)
- Select an attribute from the dropdown
- Adjust the filter values (range slider or multi-select)
- Comparables update to show only matching locations
Filter Types
Range Filters (for numeric attributes):
- Dual-handle slider to set min/max
- Histogram shows distribution
- Reset button to clear
Select Filters (for categorical attributes):
- Multi-select dropdown
- Shows count per option
- Select/deselect individual values
Managing Filters
- Clear Filters button removes all active filters
- X on individual filter removes that filter
- Filter count shown (e.g., "Showing 12 of 45 comparables")
Filtered Attribute Display
When filters are active, each comparable card shows the filtered attribute values as small pills for quick reference.
Display Options
Click the gear icon on the Smart Comps section header (visible on hover from the section control strip) to open Display Options. From here you can toggle column visibility, change the view mode, and enable an embedded section map.
Show Map
When Show map is on, a mini-map appears above the comparables list showing the subject site and all currently displayed comparables:
- Each comparable is pinned with its rank badge (#1, #2, ...) so you can see the spatial distribution of your best matches at a glance.
- Hover sync: hovering a comparable row highlights that comparable's rank badge on the map; hovering a marker on the map highlights the corresponding row in the list.
- Filtered-out comparables are not shown on the map — the map always matches the visible list.
Show Map is on by default — the gear menu's toggle opts you OUT of it, not into it. While it's on, the section also exposes a Base map selector:
| Group | Description |
|---|---|
| Performance | Lightweight vector styles optimized for speed |
| Styled | Richer themed styles (dark, satellite, and more) |
The chosen basemap is saved per-view alongside your other Smart Comps display settings.
In report viewer and shared links, the map renders from the frozen payload captured at report generation time. In headless PDF / deck export, a static map image is used instead of the live interactive map (live WebGL cannot rasterize headlessly).
Interacting with Comparables
Click to Pan the Map
Click any comparable card to:
- Pan the map to the comparable's location and select it.
- Highlight the clicked row in the Smart Comps list.
The map pan happens in place — Location Analytics stays on your subject site so you can keep comparing without losing your current analysis. To open the comparable in its own analytics view, select its marker on the map after the pan completes.
(Earlier versions of this guide said clicking a comparable opened Location Analytics for that site. That behavior changed: click now pans the map instead of opening a new tab.)
Show More/Less
- Default shows first 6 comparables.
- Click Show All X Comparables to see all.
- Click Show Less to collapse.
Forecast vs Actual Toggle (Existing Sites)
When the subject site is an existing site, the Forecast / Revenue Metrics section above Smart Comps shows a pill toggle:
- Actual Revenue — the site's recorded historical revenue.
- Zeustimate Forecast — the AI-predicted annual revenue for the same site.
Smart Comps watches that toggle and re-runs to match:
- In Actual Revenue mode, Smart Comps uses the site's actual revenue as the reference value for similarity ranking. The section is omitted if the required revenue type information cannot be resolved.
- In Zeustimate Forecast mode, Smart Comps uses the same Zeustimate revenue value shown on the gauge as its reference, so comparable ranking stays consistent with what the forecast display shows. This is also the behavior used for proposed sites.
When you flip the toggle, Smart Comps shows a loading state while the new comparables are fetched. The previous mode's results are not kept visible during the transition.
Flip between the two when you want to ask "what stores look like mine on paper?" (Forecast) versus "what stores actually perform like mine?" (Actual).
The toggle does not appear for proposed sites — they only have a Zeustimate, so Smart Comps behaves like Forecast mode by default.
How Smart Comps Work
1. Analyze Selected Site
The system examines your location:
- Demographics of the area
- Business attributes
- Geographic characteristics
2. Find Similar Existing Locations
Searches your portfolio for stores with:
- Similar demographic profiles
- Matching business attributes
- Related market characteristics
3. Rank by Similarity
Comps are ranked by:
- Overall similarity score (percentage)
- Higher scores appear first
- Rank number shows position (#1 = most similar)
4. Show Performance Data
For each comp, you see:
- Actual revenue with grade
- Distance from subject site
- Attribute values (when filtering)
Revenue Grades in Smart Comps
Both the subject site and each comparable show revenue grades:
| Grade | Label | Meaning |
|---|---|---|
| A | Top Performer | Top performers |
| B | High Performer | Above average |
| C | Average | Around portfolio average |
| D | Below Average | Below average |
| F | Needs Improvement | Significantly underperforming |
Note: "No Revenue Data" appears when there aren't enough mature sites to calculate grades.
Use Cases
For Site Evaluation
- See what revenue to expect based on similar stores
- Compare proposed site to successful existing locations
- Validate Zeustimate predictions
For Portfolio Analysis
- Identify similar stores across your portfolio
- Understand performance drivers
- Find patterns among high performers
For Due Diligence
- Verify location characteristics match expectations
- Check if comparables are truly similar
- Build confidence in projections
Tips for Using Smart Comps
Focus on High Similarity Scores
- Prioritize comps with 70%+ similarity
- Lower scores mean more differences
- Use filters to find relevant matches
Consider Geographic Distance
- Closer comps may be more relevant
- Similar markets often cluster
- Distance shown for context
Look at Revenue Range
- Note the spread across comparables
- Wide range = more uncertainty
- Tight range = more confidence
Use Filters Strategically
- Filter by attributes that matter to your analysis
- Combine multiple filters for precision
- Clear filters to see full picture
Troubleshooting
Section Shows "Couldn't Load Comparables"
- A temporary error prevented Smart Comps from fetching results. This is distinct from "No Comparables Found", which means the fetch succeeded but no matches were returned.
- Refresh the page to reload the section.
- If the error persists, check your network connection and try again.
No Comparables Found
- Site may be unique in your portfolio
- Try a different location
- Check if portfolio has enough data
Similarity Scores Are Low
- Location may have unusual characteristics
- Few similar sites in portfolio
- Consider broader analysis
Filter Returns No Results
- Filters may be too restrictive
- Try relaxing filter criteria
- Remove some filters
What the AI can do for you with this
Zeus.ai Chat can drive Smart Comps directly. Useful capabilities (named as the agent knows them in its catalog):
- Smart Comparables (
getSmartComps) — pull the ranked comp set for a site without leaving chat. - Revenue Forecast (Zeustimate) (
getZeustimate) — get the subject site's Zeustimate alongside its comps so the comparison has a reference number. - Demographics (
getDemographics) — explain why a comparable is similar by inspecting the same trade-area variables Smart Comps used. - Compare Sites & Shapes (
compareEntities) — turn a Smart Comps result into a side-by-side comparison across multiple sites. - Reports, Views, History & Help Docs (
generateReport) — package the resulting comp analysis into a deck, PDF, or web link.
Worked example
"For our top-performing site, show me the demographics within 5 miles."
The assistant runs getDemographics for the requested radius and returns a trade-area summary. From there, follow up with "Now find Smart Comps for that site" — the assistant runs getSmartComps and uses the same site context the demographics call established. This pair is exercised by the probe-scenarios/end-to-end-flows.mjs regression suite.