
Appearance
Understanding Revenue Grades
Quick Answer
Revenue grades (A, B, C, D, F) rate location performance relative to your portfolio's mature sites. An "A" means top-tier performance and "F" indicates significant underperformance. Open the Revenue Grades tab from the sidebar (Locate -> Revenue Grades) to view the portfolio distribution and adjust each grade threshold by dragging the chart, typing a percentile, or typing a dollar amount. Grade configuration is shared across all users in the project — everyone sees the same thresholds.
The tab also lets you rename the sales metric and choose how its values are displayed. By default the metric is called "Revenue" and values are formatted as currency. When you rename or reformat it (for example to "Gallons" or "Visits"), the new label and format appear throughout the product — in the tab title, Site Sonar filter, Zeustimate gauge, scorecards, location lists, and map overlays.
When Sites of Interest (SOI) layers are present, you can also configure separate metric labels, formats, and A-F thresholds for each layer.
What Are Revenue Grades?
Revenue grades provide a quick, intuitive assessment of how a location's revenue compares to your portfolio. Rather than just seeing a dollar amount, grades show where a site stands relative to the mature sites in your portfolio.
The Grade Scale
| Grade | Label | Meaning | Visual Color |
|---|---|---|---|
| A | Top Performer | Top performers in your portfolio | Emerald green |
| B | High Performer | Above average performance | Green |
| C | Average | Around the portfolio average | Yellow |
| D | Below Average | Below average but may be acceptable | Orange |
| F | Needs Improvement | Significantly underperforming | Red |
Where to Open the Revenue Grades Tab
- Open the App Sidebar on the left.
- Click the Locate product row to expand its sub-items.
- Click Revenue Grades (icon:
leaderboard). If the project has a custom metric name the tab is labeled <Metric> Grades (for example "Gallons Grades").
If the project has Sites of Interest (SOI) layers, a Grades for dropdown appears at the top of the tab. Select Existing Sites to configure project-wide grade settings, or select a layer name to configure that layer's metric and grades independently.
Existing Sites panels
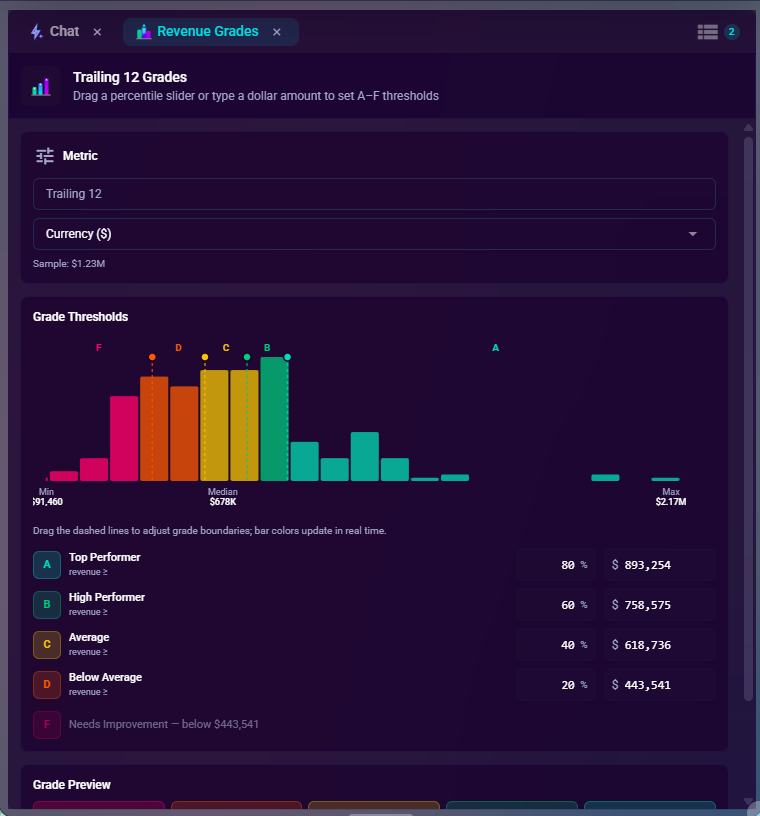
- Metric — rename the project's sales metric and choose how its values display. See Configuring the Project Metric below.
- Portfolio Distribution — an editable histogram of every eligible mature site, with dashed lines at the current A/B/C/D thresholds.
- Grade Thresholds — a table of one row per grade with a percentile input and a value input for each (the value column header reflects the active metric format).
- Grade Preview — a horizontal strip showing the F -> A bands and the value floor of each.
SOI Layer panels (when a layer is selected)
- Metric — label, format, and optional unit settings for the layer's data values.
- Distribution — a histogram of layer sites' values, with drag-to-edit threshold lines (hidden for Ranking metrics, which use a lower-is-better scale).
- Grade Thresholds — value and percentile inputs per grade.
- Grade Preview — the A-F band strip using the layer's value scale.
Configuring the Project Metric
Every project has a configurable sales metric that controls how forecasted and actual sales values are labeled and formatted throughout the product. The default is "Revenue" displayed as currency ($). You can rename it and change its format in the Metric panel inside the Existing Sites editor of the Revenue Grades tab.
Changes are project-shared — all users on the project immediately see the updated label and format everywhere in the product.
When the label is set automatically
If your project is connected to Locate data that includes exactly one non-total revenue type, that type's name (for example "Gallons" or "Visits") becomes the default metric label automatically. You can still override it here.
Metric panel controls
| Control | Description |
|---|---|
| Label | The name shown instead of "Revenue" (up to 40 characters). Leave blank to use the |
| Locate-derived default or the "Revenue" fallback. | |
| Format | How the numeric value is displayed: Currency ($), Number, or Custom suffix. |
| Suffix | Short unit appended after the value for Number and Custom suffix formats (up to 16 |
| characters, for example "visits" or "gal"). | |
| Sample | Live preview of a representative value under the current draft format. |
How to configure
- Open Locate -> Revenue Grades in the sidebar.
- If a Grades for dropdown is present, select Existing Sites.
- In the Metric panel, type a new label in the text input (or leave it blank to keep the Locate-derived name).
- Choose a Format: Currency ($), Number, or Custom suffix.
- If you chose Number or Custom suffix, type a unit in the Suffix field.
- Review the Sample preview.
- Click Save Changes. The same button also saves any pending grade threshold changes.
To revert to the default label and currency format, clear the label field, set the format back to Currency ($), and click Save Changes.
Where the metric label and format appear
After saving, the new label and format propagate to:
- The Revenue Grades tab title (<Metric> Grades)
- The Zeustimate gauge and forecast summary (headline value and AUV comparison)
- Revenue Metrics / Zeustimate Forecast cards in Location Analytics
- Scorecard Evaluation (Zeustimate and AUV values)
- The Sites tab location list and map pin hover card
- The Site Sonar revenue filter label and results table
- Smart Comparables revenue column
- Shared and frozen reports — the descriptor is baked into the report at freeze time, so recipients who open a share link see the custom label and format in Scorecard Evaluation and Impact Analytics panels, not the default "$" currency format
How Grades Are Calculated
Step 1 — Eligible-Site Cohort
The system collects revenue from mature existing sites in your portfolio. New, closed, and non-traditional sites are excluded. The same eligibility check drives both the histogram and the grade calculation, so the distribution you see in the tab is exactly the cohort being graded.
Step 2 — Threshold Source
Grade configuration is stored per project and shared by every user in that project. When you save thresholds, all teammates on the same project immediately see the same revenue grade boundaries on revenue badges, the Zeustimate gauge, site lists, and map overlays. (Scorecard letter grades are separate — they use a fixed index scale, not these Revenue Grades; see Grade Threshold Overrides in Scorecards.)
By default, grade thresholds are auto — they sit at the 20th, 40th, 60th, and 80th percentiles of the eligible-site revenue distribution. As your portfolio grows, the auto thresholds re-anchor automatically so a "B" today still means "in the top 40%" tomorrow.
You can override the defaults two ways:
- Percentile mode (recommended) — save the thresholds as percentile boundaries. Boundaries re-anchor against the current portfolio whenever sites change, so they never go stale.
- Absolute mode — save the thresholds as fixed values. Boundaries stay put regardless of portfolio change. Use this when you have an externally defined target you want to grade against (for example, a corporate AUV plan expressed in dollars or units).
The Revenue Grades tab automatically picks the mode that preserves your intent on save:
- If your typed values round-trip cleanly through percentiles, the tab saves in percentile mode so the thresholds re-anchor over time.
- If the round-trip would shift any band by more than 1% (typical when you hand-pick a specific value), the tab saves in absolute mode so your values stay exact.
- If you have fewer than 5 mature sites, percentile math isn't reliable enough — the tab saves in absolute mode automatically.
Step 3 — Grade Assignment
Each location's revenue is compared to the active thresholds:
- Proposed sites are graded against their Zeustimate.
- Existing sites are graded against their actual revenue.
The grade reflects where the site falls in the distribution at the moment you look at it.
Adjusting the Thresholds
You can edit thresholds three interchangeable ways. All three stay in sync — change one, and the others update.
Drag the Chart
In the Portfolio Distribution panel, drag the dashed threshold lines left or right. The histogram bars re-color in real time as the boundaries move, and the percentile/dollar inputs below update to match.
Type a Percentile
In the Grade Thresholds table, type a number 0-100 into any grade's % input. The corresponding dollar value is computed from your eligible-site distribution and the row updates. Percentile inputs are disabled when there are fewer than 5 mature sites.
Type a Value Amount
Type a value into the input on any row (the column header matches the active metric format, for example $ for currency or the configured suffix for other formats). The percentile column is back-computed from the eligible-site distribution.
Validation
The tab won't let you save if the bands cross over (A must be greater than B, B greater than C, etc.) or if any threshold drops to zero. A validation message appears beneath the table when the edit state is invalid.
Save and Reset
- Save Changes persists both the metric label/format draft and the current grade thresholds in one step. A "Saved" confirmation appears briefly on the button. The button is enabled when either the metric or the grade thresholds have unsaved edits.
- Reset to Auto drops any saved grade override and re-syncs to the live percentile defaults from the current portfolio. It does not reset the metric label or format.
- If a previously saved absolute override has drifted from the current auto-defaults, a yellow "Your saved thresholds may be out of date" banner appears at the top of the tab with an Update to current defaults button (a one-click equivalent to Reset to Auto).
Configuring Grades for a Sites of Interest Layer
When your project contains SOI (Layer) data, you can give each layer its own metric definition and A-F grade scale. This lets layers carrying different data types — visit counts, rankings, custom scores — be graded on meaningful, independent scales.
How to Configure a Layer
Open the Revenue Grades tab.
In the Grades for dropdown, select the layer you want to configure.
Set the Metric properties:
Field Options Label Descriptive name shown in popups and overlays (free text) Format Currency ($), Count (e.g. visits), Ranking (lower is better), Custom symbol Unit suffix Short label shown after the value (Count format only) Symbol Custom character placed before or after the value (Custom) Set Grade Thresholds the same way you would for existing sites: drag the histogram or type values into the percentile and value inputs. For Ranking metrics, the histogram is hidden (lower-is-better ordering cannot be represented as a left-to-right histogram) and thresholds represent rank ceilings (A = rank 1 to threshold, F = rank above D threshold).
Click Save Changes. The configuration is project-shared — all users see the same grades for that layer immediately.
Click Reset to Auto to remove the layer's saved config and revert to auto-percentile defaults.
Neighbor Clamping
Percentile inputs are neighbor-clamped: entering a value that would cross an adjacent grade boundary corrects the input automatically and shows a brief toast notification. Values accept decimals and are not rounded on save.
Color by Grade on the Map
After configuring a layer's metric and grades, enable Color by Grade in the layer's overlay settings (Map Settings -> Layers -> [Layer] -> gear icon) to color each SOI pin by its A-F grade. Because each layer uses its own metric scale, the grade colors are coherent even when two layers carry completely different metrics. See Visual Overlays for details.
Where You See Grades
Grades surface throughout Zeus.ai:
- The Revenue Grade badge on the Zeustimate Forecast / Revenue Metrics card in Location Analytics.
- Color-coded gauge centers on the Zeustimate gauge widget.
- Grade letters on Smart Comparables rows, in Site Sonar results lists and map hover tooltips, in the Sites tab list, and on the pin popup for proposed sites.
- The How was this calculated? panel inside Scorecard Evaluation. Note: scorecard letter grades are derived from a fixed index scale (not Revenue Grades) — see Grade Threshold Overrides in Scorecards.
"No Revenue Data" — When Grade Data Is Unavailable
If you have fewer than 5 mature sites in your portfolio, percentile calculation is unreliable. The Revenue Grades tab shows a warning banner and disables the percentile inputs, but you can still set fixed value thresholds via the value inputs or by dragging the chart.
In the rest of the app, grades may show as:
- "No Revenue Data" message
- Gray/neutral grade indicator
- Grade letter shown without a color band
To restore graded badges, either let your portfolio grow past 5 mature sites or set explicit absolute thresholds in the Revenue Grades tab.
Common Questions
Why did a grade change?
Grades are relative. If your portfolio's average changes (new high performers added, low performers retired), the thresholds re-anchor and an existing site can move grades even though its revenue didn't change. Because grade configuration is project-shared, a teammate saving new thresholds will also cause grades to change for everyone on the project.
Why is a high-performing site graded lower than expected?
Your portfolio may have even higher performers. A site near the portfolio average is graded C even if its absolute value is high. Look at the Portfolio Distribution histogram to see where the site sits in context.
Do proposed and existing sites use the same scale?
Yes. Both are compared to the same eligible-site distribution.
Can I have different thresholds per scorecard?
Yes — Scorecard Evaluation can override grading at the composite and per-section level. See Grade Threshold Overrides in Scorecards. Scorecard grading uses a fixed index scale that is independent of the project-wide Revenue Grades configured here. Revenue Grades affect revenue badges, the Zeustimate gauge, and site lists — they do not drive scorecard letter grades.